

A collapsed bridge, a flooded neighbourhood, or a hospital held to ransom by encryption comes with photographs, bills, and people to blame. A disaster successfully prevented leaves behind mostly silence. That is precisely why effective protection is so easily mistaken for money wasted on a problem that “never happened anyway.” An honest case for prevention, however, cannot rest on faith. It must show the risk, a credible scenario without intervention, the actual effect, and the cost of being wrong.
Success That Looks Like Nothing
Repair after an accident has a naturally persuasive story. We see the damage, watch the response, and can eventually calculate how much it cost to restore normal operations. Prevention reverses this sequence. Money is spent today, while the result may appear in ten years—or may never become visible at all. When protection works, there is no dramatic image to prove its value. A house that did not flood looks the same as a house no major flood ever reached. A server that withstood an attack looks the same as a server that no one attacked.
Researchers working on disaster-risk reduction therefore speak of “invisible success.” They point out that the impact of preventive action appears as absent damage, fewer casualties, or shorter service disruption. This invites what is known as outcome bias: we judge the quality of a decision by what eventually happened and overlook how reasonable it was in light of the information available when it was made. The authors of a study on retrofitted schools in Nepal therefore propose comparing the actual outcome with several plausible scenarios in which the protective measure is absent. At the same time, they propagate uncertainty in the input data through the calculation instead of offering a single self-assured figure.[1]
This logic does not mean that every alarm, levee, or security program purchased automatically saved something. It means only that “did a disaster happen?” is too crude a question for evaluating prevention. The right question is: how did the intervention change the probability and potential scale of loss compared with the situation without it? The answer may be positive, zero, or negative. Evidence, not good intentions, must distinguish among them.
How to Measure Something That Did Not Happen
Every serious evaluation begins with a baseline scenario. We must know what hazard threatens, who or what is exposed to it, and how vulnerable the affected buildings, people, or systems are. Only then can the intervention's mechanism be described: a levee is meant to reduce the extent of flooding, vaccination the likelihood of severe disease, an alarm the time until a fire is detected, and multi-factor authentication the chance that a stolen password will open an account. Without this link, an organisation can meticulously report the number of devices purchased, training sessions delivered, or kilometres of wall built without knowing whether it is genuinely reducing risk.
The most reliable evidence looks different in every field. In healthcare, effects may be captured by randomised trials or well-designed observational studies. For floods, which do not recur in the same place with the same intensity, hydrological models, exposure maps, and development scenarios are used. Fire-safety equipment can be tested in controlled experiments, and its real-world use tracked in incident data. Cybersecurity can be examined through penetration testing, simulated phishing, recovery exercises, and detection-time measurements. No method is flawless, but each can disprove some convenient assumptions.
The result should not be a magical statement that “we saved CZK 100 million,” but a range and an inventory of assumptions. How often is the event expected each year? How severe can it be? What do we count as costs and benefits? Did the protection change people's behaviour or the location of assets? How sensitive is the conclusion to the value assigned to human time, the length of observation, or the discount rate? For rare disasters, it is more honest to say “under these assumptions, the model estimates” than “the measure demonstrably saved.” Prevention needs confidence grounded in data, not the language of certainty the data cannot provide.
Evaluation also has two different time windows. Before a decision—ex ante—expected losses, the costs of alternatives, and the range of possible outcomes can be compared. Such a model helps select a solution, but it cannot contain experience from events that have yet to occur. Once a measure has been introduced—ex post—its condition can be tested and failures, false alarms, response times, and actual impacts can be monitored. Even retrospective evaluation, however, must not automatically credit the intervention for every favourable result. Weather, demographics, public behaviour, and technology may all have changed in the meantime. A good project therefore specifies in advance which data it will collect and under what rule it will revise its original estimate.
An aggregate return can also conceal who gained protection and who bears its cost. A barrier protecting an expensive commercial district may show a high value of assets saved while diverting water towards households with less capacity to recover. A digital control may reduce risk to an organisation while excluding people who lack a suitable device or the necessary skills. And a public-health programme may be effective on average yet difficult to access for the very group at greatest risk. An honest prevention account therefore shows not only the total benefit but also its distribution: who is protected, who remains outside, who pays, and whether the measure creates new risk elsewhere. Without this perspective, a project may be efficient on paper but unjust or fragile in practice.
Flooding: A Wall Is Expensive Until the Water Arrives
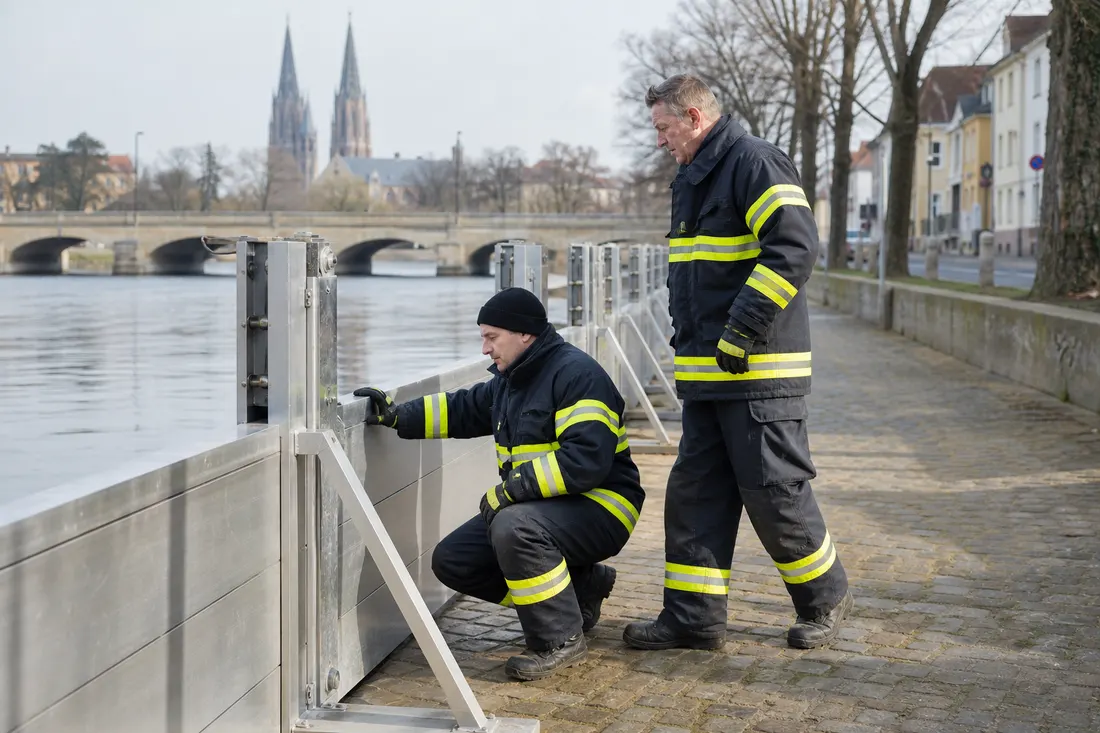
Prague's Karlín district offers an accessible but instructive example. During the 2002 flood, 28,000 residents were evacuated from Karlín and Libeň. According to the City of Prague, property damage reached CZK 7.2 billion, and the Florenc, Invalidovna, and Palmovka metro stations were also flooded. The subsequent stage of flood protection for Karlín and Libeň extends for 4.2 kilometres and cost CZK 643.5 million to build between 2005 and 2006. The city reports that the defences held during the June 2013 flood, only minimal damage occurred in the protected area, and the listed metro stations were not flooded.[2]
It would be tempting to divide the 2002 loss by the cost of the protection and announce an elevenfold return. But such a calculation would pretend that the floods of 2002 and 2013 were identical in every respect. They were not. They differed in flow, progression, affected area, preparedness, and the value of exposed assets. Moreover, “minimal damage” in the city's account refers to the protected area, not all of Prague. A summary report by the Czech Hydrometeorological Institute and the Ministry of the Environment put damage from the June 2013 flood across the country at CZK 15.4 billion, of which approximately CZK 3.84 billion was in the capital.[3] The Prague story therefore illustrates a functioning barrier well, but it is not in itself a clean experiment or a universal return-on-investment calculation.
A broader European model shows what a more cautious claim looks like. A study by the European Commission's Joint Research Centre estimated current annual damage from river flooding in the European Union and the United Kingdom at €7.6 billion, with approximately 160,000 people affected by flooding each year. Under a 3°C warming scenario without further adaptation, annual damage could rise to €44 billion by the end of the century, with almost half a million people exposed. Model-optimised retention areas in this particular scenario would require €2.6 billion a year, reduce projected damage to €8.1 billion, and yield an estimated benefit-cost ratio of 4.2 to 1.[4] This is not a promise that every euro invested in any levee will return four. It is the result of one European model, a specific climate scenario, a set of measures, and a time horizon.
Public Health: Lives Saved Are Not Entries in a Register
With vaccination, we cannot open a database of people who would have died without a vaccine and simply count them. There are only people who died and people who are alive; for one individual, we generally cannot observe both possible histories at once. Researchers therefore combine data on vaccination coverage, disease incidence, vaccine effectiveness, and mortality with mathematical models of transmission. The result is an estimate of the difference between the actual world and a world without the programme.
A study published in The Lancet in 2024 modelled the impact of vaccination against fourteen diseases in 194 member states of the World Health Organization from June 1974 to May 2024. The authors estimated 154 million deaths averted, including 101 million among children under one year of age.[5] WHO summarised the result as approximately six lives saved for every minute of the fifty-year period.[6] The word “estimated” matters here. The figure is not a list of named individuals or the result of a single experiment; it was produced by combining several models, data series, and assumptions. A transparently described counterfactual scenario is precisely what gives it meaning.
An economic evaluation of the same global programme published in 2026 included both the costs of procuring and delivering vaccines and costs borne by families. For 1974–2024, it estimated total costs of $937 billion and $15.05 trillion in productivity losses averted by preventing deaths. The resulting global benefit-cost ratio was 16.06, with a 95% uncertainty interval of 10.62 to 25.20.[7] This figure likewise does not say that “prevention returns sixteen times its cost.” It applies to the defined vaccination programme, the chosen valuation of productivity, a fifty-year period, and a particular counterfactual world.
A finding at the opposite end of the spectrum is equally important. A Cochrane review of seventeen randomised trials of general health checks among adults without selected risks found no reduction in all-cause mortality: the risk ratio was 1.00, with a 95% confidence interval of 0.97 to 1.03. The mortality analysis included 233,298 participants and 21,535 deaths.[8] This does not mean that targeted screening or regular contact with a doctor has no value. It means that the broad label “preventive” does not replace evidence of effect for a particular intervention and a particular group.
Fire Safety: The Most Valuable Minutes Come Before Firefighters Arrive
Fire is another event for which we routinely count what burned, not what was successfully protected. The Czech Fire Rescue Service's statistical yearbook reports that 19,031 fires occurred in Czechia in 2025. Direct losses reached CZK 5.27 billion, 93 people died as a direct result of fire, and 1,572 were injured.[9] These figures describe the visible part of the problem. They do not tell us how many incipient fires residents extinguished after an early warning, how many people left a flat before inhaling smoke, or how many faults an inspection removed before the first flame.
Since 1 July 2008, a Czech regulation has required autonomous fire detection and alarm systems in new and some reconstructed residential buildings. The Fire Rescue Service also recommends them for older homes.[10] The mere presence of a box on the ceiling is not an outcome, however. Its location, a working battery, a person's ability to hear the alarm, and a clear escape route all matter. Prevention should therefore be reported not only as the number of alarms purchased, but also through regular tests of their operability and whether the warning gives occupants real time to escape.
An analysis by the US National Institute of Standards and Technology based on reported-fire data estimated that the presence of a smoke alarm shortened the time to reporting a fire by an average of 19.2 minutes.[11] This is a US observational finding, not a direct measurement of the effect in Czech homes. Another NIST study also highlighted a selection problem: an alarm may make it possible to extinguish a small fire so early that it never enters the fire service database. The dataset of reported events then contains a disproportionate number of serious ones.[12] Here again, successful prevention may remove the evidence of its own success from the dataset used to evaluate it.
Cybersecurity: Fewer Incidents Need Not Mean Less Risk
In the digital world, the temptation to judge security by the number of incidents is particularly strong. But a decline may mean better defences, less willingness to report, a changed definition, quieter attacker activity, or simple chance. In a report released on 21 August 2026, the Czech National Cyber and Information Security Agency states that it recorded 203 cybersecurity incidents in 2025, 65 fewer than in 2024. At the same time, however, the agency says attackers became more sophisticated, while the Police of the Czech Republic recorded 21,137 offences involving cybercrime and internet-enabled crime—14 percent more than the previous year.[13] A single declining figure would therefore tell a misleading story.

The European Union Agency for Cybersecurity, ENISA, shows a similar distinction between frequency and impact. Its review covering July 2024 to June 2025 analysed 4,875 incidents. DDoS attacks accounted for 77 percent of recorded events, but the agency identified ransomware as the threat with the greatest impact. Of incidents for which an initial intrusion route could be determined, 60 percent involved phishing and 21.3 percent the exploitation of a vulnerability.[14] A budget focused solely on the most numerous type of event might therefore fail to protect against the greatest expected loss.
More meaningful indicators track the individual layers of resilience. How many critical accounts have phishing-resistant multi-factor authentication? How long does a known critical vulnerability remain unpatched? How many minutes does the defence take to detect a simulated attack? Can the organisation restore a key service from an isolated backup, and how quickly? In its technical guidance on cybersecurity risk management, ENISA requires regular testing of backup restoration, documented results, and corrective measures; test frequency should reflect the criticality of the data.[15] The NIST Cybersecurity Framework 2.0, meanwhile, divides outcomes into the functions govern, identify, protect, detect, respond, and recover.[16] An incident-free month is welcome. A successful recovery exercise, however, is much better evidence that the resilience paid for actually exists.
When Prevention Becomes Waste
Prevention has a moral advantage: who wants to argue against safety, health, or protecting children? That very advantage can conceal weak projects. A measure may target a negligible risk, use ineffective technology, protect the wrong place, or cost so much that the same money could prevent a far greater loss elsewhere. It may also shift the problem: a high levee accelerates water towards another municipality, excessive false alarms teach people to ignore warnings, and a security control may be so impractical that employees start circumventing it.
It is important to distinguish “saves money” from “worth the cost.” A health intervention may improve or prolong life while increasing total expenditure. That alone does not make it a mistake. An analysis of 599 studies of healthcare cost-effectiveness published in the New England Journal of Medicine noted that although some preventive measures save money, the great majority of measures assessed did not. Their value depended on the particular intervention and target population, just as it does for treatment of an existing disease.[17] The claim that “prevention always pays for itself” is therefore as unscientific as “nothing happened, so it was pointless.”
Warning signs include goals defined by the number of purchases rather than reduced risk, a return calculation with no stated baseline, selection of a single favourable year, disregard for operating and renewal costs, or refusal of independent scrutiny. A measure with no review date is equally suspect. Risks change: a river acquires a new channel, a population ages, buildings are altered, and attackers change their techniques. Even prevention that was once sensible can grow obsolete. A safety budget must therefore not become a lifetime annuity for good intentions.
Seven Questions for an Honest Budget
An invisible benefit can be scrutinised without pretending to certainty. Before approving or renewing preventive expenditure, at least the following questions should have clear answers:
- What exactly is the risk? “Flooding” or “hackers” is not enough. Probability, intensity, exposed people and assets, and their vulnerability must be described.
- How is the intervention meant to change the risk? There must be a verifiable mechanism linking the measure to the outcome, not merely a list of equipment and activities.
- What are we comparing the result with? The baseline should include a world without the measure and, where possible, cheaper or more effective alternatives.
- What is observation and what is model? Measured flows, incident counts, and recovery times must be distinguished from estimated losses, lives saved, and future scenarios.
- How broadly are we counting costs and benefits? Alongside the purchase price, the account should include maintenance, staff, training, false alarms, outages, effects on other groups, and the equipment's useful life.
- What are the adverse effects and uncertainties? A serious proposal discloses the range of outcomes, sensitivity to its main assumptions, and the risk that the measure merely shifts the harm.
- When will we review the project? Tests, responsibilities, thresholds, and a review date defined in advance make it possible to modify or end the measure.
This approach changes the debate. It is no longer a contest between “safety at any cost” and “cuts at any cost.” It becomes a comparison of expected outcomes, costs, and uncertainties. It allows expensive protection to be defended where it reduces a major risk and a striking gesture to be rejected where evidence is lacking. It also protects prevention professionals from the unfair demand that they prove their success through the disaster they were supposed to avert.
The Cost of the Disaster That Never Came
One important weakness of prevention in politics and ordinary life is a mismatch in time. Costs come with an invoice and a due date. Benefits are dispersed, uncertain, and often belong to people who will never learn that they were protected. After several quiet years, a barrier, vaccination programme, electrical inspection, or backup data centre therefore begins to look extravagant. If we abolish it, the saving is immediate and visible. The increased risk remains invisible until the day it is usually too late.
A sensible society does not resist this bias by giving every preventive institution a blank cheque. It resists through better evidence. It preserves baseline data, tests functionality, compares alternatives, publishes model assumptions, and after an event examines not only failures but also the places where measures genuinely limited harm. It accepts that some benefits can be expressed only as probabilities and that uncertainty is no disgrace when described honestly.
A prevention account therefore needs two columns. The first contains the price actually paid. The second contains not invented certainty, but the best available estimate of the loss the measure averts with a given probability, including the boundaries of that estimate. Only the two columns together show whether the silence after an intervention is the result of luck, effective protection, or an expensive ritual. A disaster that did not happen proves nothing by itself. Well-designed prevention, however, can demonstrate its value before the day we need it.