

The price tag says CZK 199. The figure looks precise, almost definitive. Yet it describes only one thing: how much a customer must pay in a particular shop. It does not say where the raw material was grown, who wove the fabric, how much the sewing worker received, how much energy dyeing consumed, or what happens to unsold items. The CZK 199 in this article is a model price tag, not the price of a traced product. Without a brand's internal data, its margin, its suppliers' costs, and the footprint of a particular T-shirt cannot be reconstructed honestly. We can nevertheless show why a receipt is only one side of a much longer account.
1. There Is Very Little We Can Separate Precisely from the Price Tag
Let us begin with what can genuinely be calculated. Czechia's standard value-added tax rate is 21 percent. The current European overview still listed this rate for Czechia when checked in July 2026, and the Czech Financial Administration confirms the same rate.[1][2] If the model price of CZK 199 is an ordinary final price for a T-shirt including VAT, the price before tax is CZK 164.46 and the VAT itself is CZK 34.54. The tax is not calculated as 21 percent of the full CZK 199 because it is already included in that amount.
That, however, is where certainty ends. The remaining CZK 164.46 is not “the manufacturer's share.” It may include the raw material, production of yarn and fabric, dyeing, sewing, packaging, transport, customs duty, wholesale, operation of the shop or online store, employee wages in Europe, payment fees, marketing, discounts, returns, losses on unsold stock, and profit. The exact proportions vary with the material, order volume, country of origin, business model, and whether the item is being sold at full price or on clearance.
Nor is margin the same as net profit. The difference between purchase and sale price finances the entire retail operation and carries the risk that some of a collection will sell only at a discount, or not at all. Without the invoices, contracts, and accounting data of a particular company, the price tag cannot reveal how much “the brand kept.” A popular infographic showing a universal breakdown of the price may illustrate one particular order. It is not an accounting record for our model T-shirt.
2. One T-Shirt Is Not a Product from One Place
A T-shirt on a hanger looks like a simple object. Its supply chain may be anything but simple. The OECD describes common stages ranging from fibre production or extraction through processing, spinning, knitting or weaving, wet processing, dyeing, and finishing, to cutting, sewing, inspection, and distribution. Traders, buying agents, and subcontractors may enter the chain. A brand may know the factory that assembled the finished item but have considerably less visibility of who made the yarn, dyed the fabric, or harvested the cotton.[3]
The word “material” also conceals very different worlds. Cotton begins in agriculture. Polyester begins in a petrochemical chain. Viscose connects forestry with the chemical processing of cellulose. A fibre blend may improve performance in use but make recycling harder. A button, print, sewing thread, and label may each have their own suppliers. The country shown on the label usually does not tell the complete story of all the inputs.
World trade data show the extent of this interdependence. According to a WTO sectoral profile, textiles and clothing accounted for 3.7 percent of global merchandise exports in 2022, with Asia supplying 70.6 percent of those exports. In some Southeast Asian countries, imported inputs made up a large part of export value: the WTO reports foreign value-added shares of 64 percent for Vietnam and 58 percent for Cambodia in their textile and clothing exports.[4] A T-shirt can therefore be cut and sewn in one country from fabric whose fibre, yarn, dye, and energy originated elsewhere.
This does not mean that every product travelled around the world in the same way. It means only that “made in” is insufficient to reconstruct the entire journey. For a particular T-shirt, we would need at least its composition and weight, a list of production sites, the origin of its materials, the processes used, and the mode of transport between them. Without these details, we can describe a typical chain but cannot prove a specific route.
3. Value Is Not Created Only at the Sewing Machine
The WTO attempted to break down not the retail price, but the origin of value added in global textile and clothing exports. In 2022, the textile and clothing industry itself accounted for 36.4 percent of this exported value added. The remaining 63.6 percent came from other sectors: services, agriculture, chemicals, and other manufacturing. Distribution and transport services together represented 15.4 percent of exported value added.[4]
It is important not to use this figure as a formula for dividing up CZK 199. Exported value added is not a retail price tag, and a global average is not one company's account. The data do, however, correct the simplistic idea that almost all of a garment's value is created at the moment someone sews it together. Farmers, chemical plants, energy providers, machinery manufacturers, logistics, finance, design, quality control, warehouses, and retail all contribute to the product.
At the same time, this tells us nothing automatically about whether rewards are distributed fairly. Not everyone in a global chain has the same bargaining power. A brand or major buyer decides on the order price, deadline, quality, and volume. The supplier bears the costs of materials, workers, and production capacity before receiving payment. When an order changes at the last minute, a deadline is shortened, or the price fails to cover realistic costs, the pressure may move further down the chain—into overtime, temporary labour, or undeclared subcontracting.
That is precisely why the OECD does not treat a company's responsibility as merely inspecting a factory. Due diligence also covers its own purchasing practices: how the company plans, negotiates prices, changes orders, and pays suppliers.[3] A supplier's low offer is not in itself proof of rights violations. Equally, a certificate or audit is not in itself proof that the commercial terms can sustainably finance safe work and adequate wages.
4. Labour Is the Least Visible Part, Yet It Holds the Whole Chain Together
In 2025, the International Labour Organization reported that the textile and clothing sectors employ more than 90 million people, most of them women.[5] This is an important counterweight to the image of an industry that only causes harm. For many people, garment production is a source of income and a point of entry into paid employment. Abruptly cancelling orders or brands withdrawing without due care can harm workers just as tangibly as poor conditions do.

The industry's size does not erase its problems. In an overview published in February 2026, the OECD describes widespread risks of low wages, non-payment or underpayment, irregular incomes, long working hours, weak protection for informal workers, and limited ability to refuse overtime. It explicitly warns that short lead times, poor planning, and buyers' purchasing practices can increase reliance on overtime and, with it, fatigue and the risk of accidents.[3]
An empirical ILO study based on fieldwork in Bangladesh, China, India, South Africa, and Türkiye linked supplier-management data with information about their employees' working conditions. It examined relationships between purchasing practices and wages, working hours, injuries, temporary employment, and outsourcing.[6] It is not an identity card for our model T-shirt or a current global rate of rule-breaking. It supports a much more measured conclusion: a decision made at a purchasing desk in a wealthy country can affect conditions in a distant factory.
Yet the price tag of CZK 199 cannot tell us the wage of the person who sewed the item. We do not know the production time, the number of items in the order, the local wage system, benefits, productivity, exchange rate, or whether the factory was fulfilling orders for several brands at once. Nor can we claim that a more expensive T-shirt automatically means a higher wage. A higher price may finance better materials and labour, but it may also finance a more expensive shop, marketing, or profit. Traceable data and verified working conditions are evidence; the amount on the tag is not.
5. The Environmental Account Exists, but Not as One Monetary Figure
The European Environment Agency calculates the impacts of European household consumption at a broader scale. In 2022, an average of 19 kilograms of newly consumed clothing, footwear, and household textiles was attributed to each EU resident: approximately eight kilograms of clothing, four kilograms of footwear, and seven kilograms of household textiles. This is so-called apparent consumption, calculated from production, imports, and exports—not by weighing every household's shopping bags.[7]
According to the same model, producing this consumption required 234 million tonnes of raw materials, or 523 kilograms per EU resident. The figure is far higher than the weight of the finished products because it captures material inputs across the supply chain, not the contents of a wardrobe. The model also estimates 12 cubic metres of surface and groundwater consumption—the so-called blue-water footprint—per person, and 323 square metres of land use. About 85 percent of the blue water and more than 80 percent of the impact on land occurred outside Europe; for greenhouse-gas emissions, the share was about 70 percent.[7]
These figures must not be presented as the footprint of one T-shirt either. They include clothing, footwear, and household textiles and average across different materials, countries, and technologies. They do, however, reveal an important geographical shift. A product is consumed in Europe, while much of the burden on water, land, and the climate arises where the fibre is grown and the material processed.
With water, moreover, the number of litres is not enough. A litre consumed in an area with ample rainfall does not have the same significance as a litre withdrawn from a water-scarce basin. For emissions, the energy mix of the spinning and dyeing facilities matters. Chemical impacts depend on the substance used, the dose, and wastewater treatment. Synthetics add a fossil feedstock and microfibre release; cotton adds land, agricultural inputs, and sometimes irrigation. No single metric can therefore represent the entire environmental account honestly.
6. Even Science Offers No Single Universal Number for a T-Shirt
The range is illustrated by a peer-reviewed study published in April 2026. The authors modelled production of a 0.2-kilogram cotton T-shirt under several technological and geographical scenarios. The result for climate change ranged from 1.51 to 7.68 kilograms of carbon-dioxide equivalent per item. The differences arose from technology, the location of production stages, the mode of transport, and assumed overproduction, among other factors.[8]
The range is more useful than one eye-catching figure. The study did not assess the particular T-shirt priced at CZK 199. It also tracked the journey from cotton cultivation to retail but deliberately excluded use, washing, and end of life. Some inputs were based on primary data, others on databases and scenario assumptions. The authors themselves state these limitations.
In their scenarios, fabric production accounted on average for about 73 percent of the climate impact, mainly because of energy-intensive dyeing. In variants involving air freight, however, distribution's share rose markedly, and rapid transport outweighed some of the savings achieved through lower overproduction.[8] This does not mean that transport is always negligible or that it always dominates. It depends on the route and mode of transport. A container ship and air cargo are not interchangeable entries.
The European Product Environmental Footprint methodology for apparel and footwear therefore covers the entire life cycle, from raw materials through production and logistics to use and end of life.[9] An honest comparison must use the same functional unit and the same boundaries. A T-shirt worn fifty times cannot simply be compared with one worn five times using only the production impact per item. Nor can water, carbon, toxicity, and land be combined into a single unproblematic figure without publishing the weighting method.
7. Part of the Account Accrues Before the First Wear, and More after the Last
Not every manufactured item reaches a wardrobe. The European Commission cites an estimate that between 4 and 9 percent of unsold textiles are destroyed before use in Europe. New rules under the Ecodesign for Sustainable Products Regulation prohibit large companies from destroying unsold apparel, clothing accessories, and footwear from 19 July 2026; the corresponding date for medium-sized companies is expected to be 2030. There are justified exemptions, for example on safety grounds or because of irreparable damage, and standardised disclosure of quantities of discarded products is due to begin in February 2027.[10]
The rule also matters for understanding price. The risk of unsold collections and returns does not disappear. A company may factor it into planning, margins, discounts, and decisions on production volumes. But we cannot claim that our model T-shirt is cheap precisely because of overproduction or that every returned item ends up in an incinerator. Such a conclusion would require data from the particular retailer.
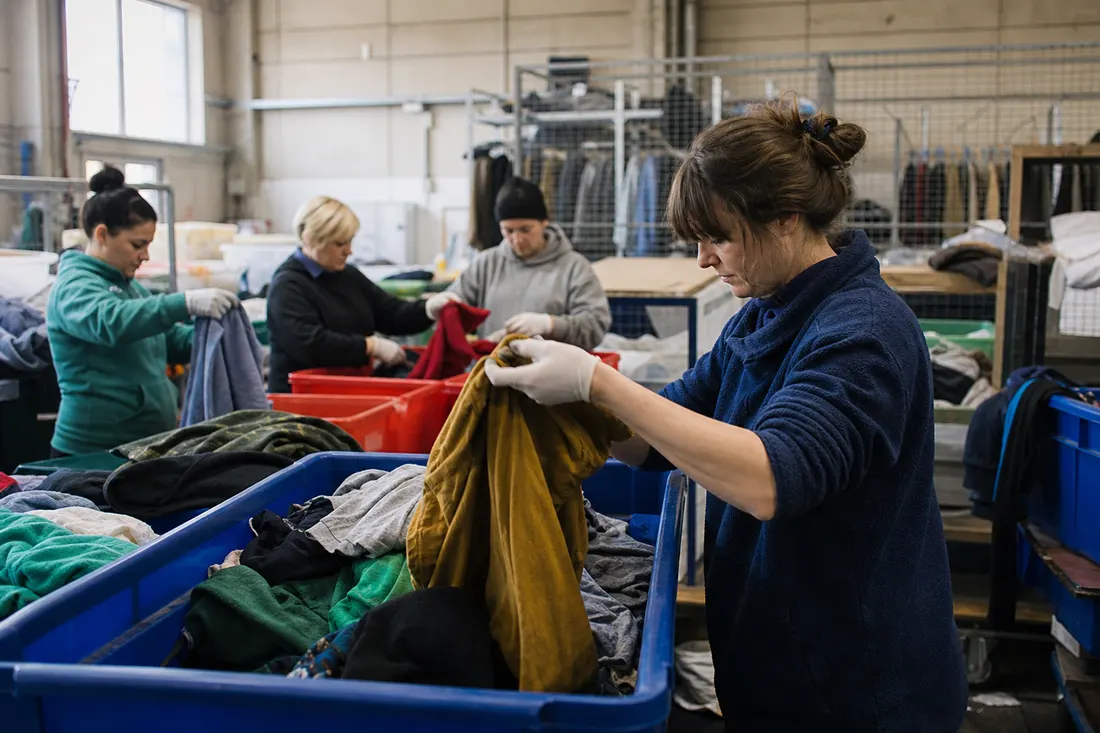
At the other end of the life cycle, the EEA reports that EU countries generated about 6.94 million tonnes of textile waste in 2022, an average of 16 kilograms per person. Less than 15 percent of household textile waste was collected separately; the remainder mostly entered mixed waste, where the possibility of reuse or recycling is sharply reduced.[7]
Even placing an item in a collection container does not guarantee a simple closed loop. The EEA reports that the EU exported more than 1.44 million tonnes of used textiles in 2025, mainly to Asia and Africa. Some are reused, some recycled or re-exported, and some may end up in landfill or be incinerated. The agency also stresses a fundamental uncertainty: trade codes do not reliably distinguish good-quality reusable clothing from textile waste, and the final fate of shipments is not fully known.[11] Both “donated clothes are worn again” and the opposite claim, “everything ends up in landfill,” are too strong without further data.
8. A Cheap Item Is Not Automatically a Moral Failure by the Buyer
It is easy to turn environmental and labour risks into a judgement on the person at the checkout: surely they should have bought less and paid more. That conclusion overlooks unequal budgets. Eurostat reports that in 2024, 6.4 percent of the EU population experienced severe material and social deprivation, meaning the enforced lack of at least seven of thirteen monitored items.[12] The methodology's individual items include being able to replace worn-out clothes with new ones and having two pairs of properly fitting shoes.[13]
In its overview of living conditions for 2024, the Czech Statistical Office reports that 2.3 percent of people lived in households that could not afford to replace worn-out clothes with new ones for financial reasons.[14] This is not a majority, nor is it a profile of a particular shop's customers. It is sufficient reason not to pretend that everyone has the same range of choices.
Affordable clothing may be a practical necessity for a child who has outgrown a size, a person starting a job, or a household whose budget has been consumed by housing and food. This reality does not erase companies' responsibility for working conditions and production impacts. It does, however, shift the centre of the question: the system must not work only when every customer can pay a premium and also personally audit a global supply chain.
The call to “stop buying” must be treated with equal caution. The garment industry supports tens of millions of livelihoods. A responsible course is not to cancel orders from a high-risk supplier overnight and leave workers with the consequences. The OECD recommends first using the company's leverage for prevention and remediation, engaging with suppliers, and considering possible harms when ending a relationship.[3] The goal should not be less decent work, but fewer business models that cannot pay for and demonstrate decent work.
9. A More Honest Price Tag Would Not Display One Magic Number
The “true cost” in the headline is not a hidden amount that can be added to CZK 199 after applying a few averages. The economic price at the checkout, remuneration throughout the chain, and environmental or social impacts are different quantities. Some impacts can be converted into money only through contested assumptions: how should we value a tonne of emissions, water scarcity in a particular basin, a health risk, or biodiversity loss? Without a published method, the resulting total would appear more precise than it really is.
It helps to distinguish three separate ledgers. The first records the transaction: tax, invoices, purchase price, operating costs, and profit. The second tracks the distribution of power and rewards: who determines the order price, who finances production in advance, who bears the risk of a changed deadline, and whether wages support a decent life. The third records physical impacts: materials, energy, water, emissions, chemicals, lifespan, and waste. The receipt shows a fraction of the first ledger. It does not contain the second or the third.
These ledgers are related, but they cannot be conflated. A low production price may result from an efficient process, a large order, or cheaper energy; it may also accompany pressure on wages or deferred expenditure on wastewater treatment. A higher price may finance better materials and more responsible production, but without evidence it may simply reflect branding and distribution. Likewise, a low carbon footprint says nothing automatically about wages, and good working conditions do not themselves solve water use. An honest product therefore needs several clear and verifiable indicators, not one all-powerful score.
A more honest information label would therefore open up more fields. It would show the product's composition and weight, the origin of its fibres, the locations of spinning, fabric production, dyeing, and sewing, subcontractors, the mode of transport, its product environmental footprint with clearly defined boundaries, durability-test results, repairability, and a plan for returns and end of life. On labour, “ethically made” would not be enough. We would need to know which wage benchmark was used, whom the audit covered, whether workers could speak without management supervision, and how the purchase price and deadlines allowed for remediation.
Consumers can influence part of the impact: buy only what they will use, wear items for longer, wash appropriately, repair, and choose further use instead of mixed waste. These are real steps, not a complete solution. A person standing by a clothing rack does not determine the dyeing facility's energy mix, the contract with the factory, the size of the collection produced, or the design of a fibre blend. Companies have more information and bargaining power than an individual customer and to rules that require traceability, responsible purchasing practices, more durable products, and truthful disclosure of results.
A T-shirt at the model price of CZK 199 is therefore not in itself proof of exploitation. Nor is it proof of good work, a low footprint, or smart business. It is a precise answer to a narrow question: how much we pay today. Only a traceable chain would answer the others: who was paid, who carried the risk, where the impact arose, and how long the product will serve.
The receipt does not lie. It is simply too short for the whole story.