

The legal limit, actual speed, and speed appropriate to conditions are not the same thing. A driver can adhere to the maximum limit and still be driving inappropriately on a wet single-carriageway road. National accident statistics may fall without any change to the basic 50/90/130 table, and a divided motorway has a different risk profile than a street with pedestrians. Accident fatality figures alone, without data on kilometres driven, do not determine the level of risk.
1. The sign, appropriateness, and impact are not the same
Imagine a parliamentary committee meeting on speed. The Minister of Transport holds up the annual report: in 2024, the police investigated 92 217 accidents, with 438 fatalities and 1 609 serious injuries. In 2025 85 518 accidents and 421 fatalities — the lowest number since consistent statistics began in 1961.[1][2] A Vision Zero advocate wants a blanket thirty in built-up areas. A proponent of traffic flow wants 150 km/h on a selected motorway. A traffic engineer puts the ERSO data on the table: in 2022, 39.8 per cent of passenger cars on motorways drove within the limit, 54.5 per cent outside built-up areas, and 57.3 per cent in built-up areas.[4] A police officer reminds them of Section 18: speed must be adapted to conditions, not just the sign.[5] An emergency doctor speaks about the impact of a collision with a pedestrian at fifty.
The "slow down versus speed up" debate mixes several distinct goals. The Ministry monitors the trend in fatalities, advocates of 30 zones focus on vulnerable road users in built-up areas, drivers want motorway flow, ERSO tracks compliance with limits, the law focuses on appropriateness, and medical professionals focus on the consequences of the impact.
Each goal may be legitimate, but one cannot derive a solution for all roads from a single one. A proposed limit must combine the sign with geometry, weather, compliance, traffic volume and composition, and the presence of unprotected road users.
It is therefore necessary first to determine the type of road and the measured outcome. The D3 pilot, a residential street, a frozen single-carriageway road, and the penalty point system have different users and different indicators; they should not form a single, undifferentiated dispute.
The number on the sign determines the legal maximum. Actual speed and the police classification of the cause of an accident are different data points.
— Jiný Kontext
What we know about the D3 pilot — and what we do not yet
What we know: The Ministry of Transport has published the section, the launch date, the rules for variable signage, and the ongoing proportions of the various modes.[23] What we are observing: Under the 150 mode, average speed increased by approximately 10 km/h, and some drivers continued to exceed the limit. What we do not know from the data so far: The long-term causal effect on the accident rate and the severity of consequences; the Ministry has extended the pilot precisely because the period was not sufficiently representative.
2. From the limit to the consequence of the accident
The statement "speed is to blame for the death" does not say whether it was a breach of the maximum limit, a failure to adapt to conditions, or the greater severity of the impact. The outcome is influenced by actual speed in conjunction with the road surface, geometry, the vehicle, and the type of road user. Two accidents under the same sign may therefore have different mechanisms.
Five layers of a single speed tragedy
- Formal limit: 50 / 90 / 130, local regulation, 30 zone.
- Proportionality: § 18 para. 1 — skills, road surface, visibility, line of sight.[5]
- Actual speed: the speed at which the car was travelling, not the speed indicated on the sign.
- Geometry and traffic: width, curvature, crash barriers, pedestrians, lorries in 80.
- Consequence: kinetic energy, mass, angle, protection of the crew and persons outside.
The basic statutory table establishes the rules, while geometry influences the intuitive choice of speed, the radar its enforcement, and vehicle assistants the possibility of avoiding a collision. Police speed categories therefore require further breakdown according to the extent of the limit breach, conditions, and the course of the accident.
Without this distinction, an accident becomes merely a dispute over a sign. If a driver exits a bend at the limit of 90 on icy roads, the speed may be disproportionate to the conditions even without exceeding the maximum. If a wide municipal through-road leads to frequent speeding, a new sign alone may not change the actual speed without adjustments to geometry or enforcement. On the motorway, it is necessary to monitor both absolute speed and the differences between the flows of cars and HGVs.
Illustrative diagram: The chain between the sign and the victim passes through proportionality, actual speed, geometry, and impact energy. A break in any link changes the meaning of the slogan "slow down".
3. The limit must correspond to the risk of the section.
The public often compares only the limit numbers. Equally important are the traffic, geometry, and vulnerable road users in the given section. Exceeding the maximum is an offence on every type of road, but the probability and severity of the consequence vary by environment. An incorrectly set sign can be replaced; the consequence of a collision cannot.
BESIP and CDV state that inappropriate speed accounts for approximately 40 per cent of fatal accidents, and explicitly add that this is not just about exceeding the maximum, but about failing to adapt to conditions.[3][8] This is a police classification of causes, not laboratory proof that 40 per cent of victims were speeding in dry conditions. Between 2021 and 2023, CDV counted 492 fatalities and 1 230 serious injuries in this category.[8]
| Type of failure | What it looks like | How to test it | What limits the harm |
|---|---|---|---|
| Sign failure | Limit does not match geometry | Measurement of actual speeds, not just the regulation | Construction, narrowing, threshold |
| Failure of proportionality | Below the limit, above the conditions | Protocols, weather, visibility | § 18, telematics |
| Failure of enforcement | The limit exists, the radar does not | Proportion within the limit (ERSO, CDV) | Average speed measurement |
| Failure of location | Motorway debate on the urban body | Separate types of roads | A different limit for a different world |
A political decision must determine what risk the limit is intended to reduce in a given section and how the effect is to be measured. Exceeding the maximum speed limit and speed inappropriate to conditions must be reported separately, as their overlap is not complete.
The safety of a section is influenced, alongside vehicle capabilities, by actual speed, geometry, separation of opposing traffic, enforcement, and the presence of vulnerable road users. These characteristics form a hypothesis that must be verified by comparable exposure and accident rates; signs and crash barriers alone do not determine the safety ranking.
4. Annual statistics do not prove the effect of a single sign
Yearbooks are necessary because they replace a series of impressions with data. The problem arises when a single annual figure is taken to represent the effect of a single sign. Police in 2024: 92 217 accidents, 438 deaths, 1 609 serious injuries, damage of 7 991.7 million CZK. In 2025: 85 518 accidents, 421 deaths, 1 647 serious injuries, damage of 8 346.9 million CZK.[1][2] The year-on-year decrease of 17 fatalities is a fact. It is not proof that it was caused by a specific amendment to the speed limit.
Every report contains methodological decisions. What constitutes an "accident" in the police definition? Which cause is designated as the primary one? How is inappropriate speed coded? In the Czech Republic overview 2024, ERSO states that in 2021, out of 532 deaths, 22 occurred on motorways, 323 on roads outside built-up areas, and 187 in built-up areas.[4] These are absolute numbers and proportions of victims, not the risk per vehicle kilometre travelled; to compare the safety of different road types, corresponding traffic exposure data would be required.
What must accompany claims about the effect of a speed limit
- The year, the definition of fatality (within 24 hours vs. 30 days, if they differ).
- The type of road, not the republic as a whole.
- Whether it concerns the limit, proportionality, or actual speed.
- The proportion of vehicles within the limit on the given section.
- The convergence of cars, infrastructure, and rescue operations.
For the design of a pilot project, a sectional cut including weather, geometry, intensity, and actual speeds is therefore useful. Thirty days may reveal average speed and the level of compliance, but usually not enough to evaluate changes in rare outcomes, such as fatal accidents. Those require a longer period, comparable exposure, and a suitable control section.
5. Let us compare roads, not slogans about speed.
The network can be described without a false sense of winners. The following map does not say who is for life and who is for freedom. It shows what kind of risk individual worlds carry and which failures the debate should specifically seek.
| World | Main risk | What to verify | Typical reason for slogan |
|---|---|---|---|
| Motorways | High absolute speed, differences between lanes, fatigue | Intensity, telematics, speeds and accidents | Smooth flow, 150 km/h[5] |
| First and second-class roads outside built-up areas | Trees, bends, overtaking | 61 % of deaths (2021)[4] | "District roads kill" |
| Built-up area 50 | Pedestrians, cyclists, crossings | Actual speed, construction | 30 zones |
| Through traffic | Width increases to 70 in a fifty zone | Geometry vs sign | Traffic calming |
| Frozen Third Class | Proportionality below the limit | Protocols, weather | § 18, not a new table |
The table does not assess drivers as a group. It distinguishes between environments in which the same person faces different obstacles, speeds, and vulnerable road users. Therefore, the argument regarding pedestrians in a built-up area cannot be directly transferred to the D3, and vice versa.
How to read the diagram: The physics of the impact is the same, but a built-up area, a single-carriageway road, and a motorway differ in geometry, traffic composition, and the presence of vulnerable road users. Safety indicators must therefore correspond to the specific environment.
6. The trend is falling. Table 50/90/130 has barely moved.
The long-term series is sober. Deaths have fallen by more than 70 per cent compared to 2000. The basic limits of 50 in built-up areas, 90 outside, and 130 on motorways have remained in place with local adjustments throughout this period.[5]
| Year | Total accidents | Fatalities | Seriously injured |
|---|---|---|---|
| 2000 | 211 584 | 1 486 | 5 500 |
| 2010 | 75 522 | 753 | 3 135 |
| 2020 | 94 797 | 460 | 1 807 |
| 2024 | 92 217 | 438 | 1 609 |
| 2025 | 85 518 | 421 | 1 647 |
Source: Directorate of the Traffic Police; the figure for 2020 is based on police information of 94 797 accidents.[1][2][14]
This decline cannot be attributed to a general reduction in basic limits. Long-term development is influenced simultaneously by vehicles, infrastructure, behaviour, enforcement, and the emergency response system; however, the contribution of each component cannot be calculated from the time series alone.[6][7][20] Evans describes safety as an interplay between the vehicle, the road, and behaviour, rather than a single lever.[6] This does not prove that limits are redundant; it merely limits the causal conclusion drawn from the aggregate trend.
The BESIP 2021–2030 strategy set a lower target for fatalities for 2024 than what eventually occurred; the Deputy Police President stated regarding the figure 438 that the target of 408 was not met.[1] The decline is historically low. It is not a fulfilled plan. Both sentences can be true at the same time.
Meanwhile, the number of registered vehicles has increased, but the state of the register is not the same as the number of kilometres driven. To determine the level of risk, traffic exposure by road type is necessary. The current decline in the absolute number of victims is a positive trend, but not in itself an evaluation of the 150 km/h limit.
7. Kinetic energy does not increase linearly
The laws of physics cannot be overruled. Kinetic energy increases with the square of the velocity: E_k = 1/2 m v^2. An increase from 50 km/h to 60 km/h means an energy increase of 44 per cent. An increase from 130 km/h to 150 km/h is an increase of 33 per cent. This is arithmetic, not accident statistics. It explains why ten kilometres per hour in a built-up area near a pedestrian is a different gamble than twenty on a divided motorway.
Braking distance adds reaction time. With a one-second reaction time on dry asphalt, a vehicle at 50 km/h stops within a few dozen metres; a vehicle at 60 km/h is still moving at that same point. The exact metres depend on tyres, gradient, and surface; the order of magnitude is robust, not a centimetre-accurate textbook price list.
Elvik's power model relates changes in average speed to changes in accidents of various severities: fatal outcomes react more sharply than minor ones.[11] It is a statistical model derived from numerous studies, not a promise that a blanket −10 km/h on Czech motorways will reduce fatalities by a fixed percentage, regardless of compliance or traffic composition.
For pedestrians, individual risk curves vary according to data, age, vehicle type, and the definition of impact speed. WHO, ERSO, and ITF overviews agree on the main point: as impact speed increases, the probability of severe or fatal injury rises sharply.[15][16][19] The exact percentage at 30 or 50 km/h should therefore not be transferred between studies as a universal constant. Furthermore, an environment with pedestrians is not a direct analogue to a directionally separated motorway.
8. Inappropriate speed is not the same as exceeding the speed limit.
Czech media cite that inappropriate speed is the cause of more than 40 per cent of fatal accidents.[3] It is necessary to keep these two states separate.
The first is an offence against the limit: 105 km/h where 90 applies. The second is the obligation under Section 18, Paragraph 1 to adapt speed to abilities, load, road conditions, weather, and visibility; a driver may only drive at a speed that allows them to stop within the distance they can see.[5] If a vehicle emerges from a bend on a frozen rural road in fog at 60 km/h with a limit of 90, the police may, after investigation, deem the speed inappropriate for the conditions. A lower limit may influence behaviour, but it does not in itself guarantee that the chosen speed will be safe on ice.
The CDV explicitly distinguishes between exceeding the limit and a speed that does not correspond to the conditions.[8] The categories may overlap, but they are not identical. A lower limit may reduce actual speeds and the severity of consequences; however, the police share of "inappropriate speed" does not in itself indicate what effect a specific change in signage would have.
9. Most drivers do not read the sign. They read the road.
ERSO Country Overview Czechia 2024 cites Baseline measurements: in 2022, 39.8 per cent of monitored passenger cars on motorways, 54.5 per cent on rural roads, and 57.3 per cent in built-up areas were within the speed limit.[4] Field measurements cited by the CDV report 37.0 per cent on motorways, 48.0 on rural roads, and 64.9 in built-up areas.[9] These are specific selections of locations and time periods, not a census of all Czech journeys. They show the difference between the regulation and the observed speed within the monitored sample.

In the ESRA3 survey, 24.4 per cent of Czech respondents expressed support for a blanket thirty in built-up areas; more than 68 per cent of drivers surveyed did not expect speed checks, and nearly 60 per cent admitted to exceeding the motorway limit in the last 30 days.[9][10] These are sample-based and partly self-reported data, not the behaviour of all drivers. BESIP data on regular speeding comes from a different type of communication and cannot be simply merged with field measurements.[3]
What needs to be tested
The first test concerns geometry: does the width encourage a speed that the sign prohibits? The second concerns enforcement: average speed cameras or a single sign outside a built-up area? The third concerns the expectation of being caught. Simply changing the number without narrowing the road, adding speed bumps, and enforcing the law changes the regulation. It does not automatically change the 85 percentile of speed.
A wide, straight road in a built-up area may encourage higher speeds, especially if enforcement and traffic-calming measures are lacking. Nevertheless, the sign remains legally binding and may influence the behaviour of some drivers; geometry determines whether the desired speed is also intuitive.
10. Motorway 150 and urban 30 are two different worlds.
The debate in Czechia polarises two proposals that share the word "speed" but not the physics.
Section 18, paragraph 7 of the Act allows for a local increase of the motorway speed limit by up to 20 km/h, i.e. to 150, and in municipalities, according to paragraph 6, a reduction below 50.[5] The pilot operation on the D3 was launched on 1 October 2025 on the section between kilometres 84 and 131. Variable signage, adjusted according to traffic and weather, sets the limit at 100, 130 or 150 km/h. In May 2026, the Ministry of Transport extended it until the end of 2026, as winter operation in the higher mode provided only a limited sample; in the first six months, the 150 mode was active 39 per cent of the time, and the average speed of passenger vehicles was approximately 10 km/h higher than in the 130 mode.[23] These are provisional data from a single section, not final proof of safety or a result applicable to all motorways.
30 zones are primarily used where motor vehicles encounter pedestrians and cyclists. Precise risk curves vary between studies, but safety system overviews link lower impact speeds with a significantly lower probability of fatal injury to unprotected road users.[15][16][19] This supports targeted traffic calming in areas with pedestrians, rather than a blanket proposal applied automatically without assessing the street network.
Mechanically linking both topics into a general opposition to or support of "speed" ignores the fact that pedestrians should not be on motorways and lorries should not drive in residential zones as if they were on the D1. These are two different worlds. A discussion on both without a table of road types is a discussion of slogans.
An illustrative comparison might place side by side driving on a dual-carriageway motorway under good conditions and driving on a nighttime third-class road lined with trees. Both situations require adherence to the limit and proportionality, but they differ in geometry, oncoming traffic, obstacles, and the possibility of enforcement. Absolute numbers of fatalities off motorways suggest this difference, but without vehicle-kilometres, they do not quantify the relative risk of either journey.[4]
11. The radar monitors speed, not the entire section.
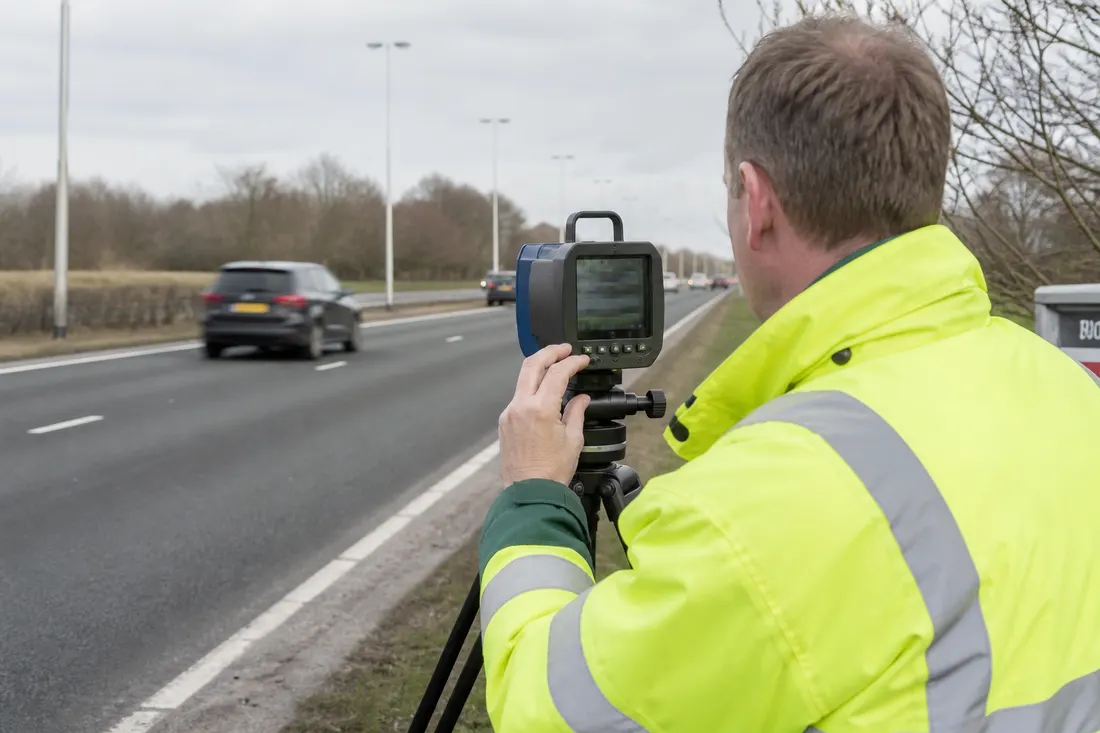
Before the radar, a police officer had to drive behind the car. With section control, something else is monitored: the average between two points on a selected section. It does not see black ice beyond the horizon. It does not see overtaking on a single lane. The sign and the radar are navigation aids for the law. They are not automatic proof that the section is safe.
The drop in the number of fatalities from 438 to 421, the proportion of inappropriate speed in fatal accidents, and the 39.8 per cent of vehicles within the limit on monitored motorways have different denominators. It cannot be inferred from them that lowering the motorway limit to 110 will save forty per cent of victims; such a conclusion would confuse a nationwide trend, police classification, and compliance measurements.
Four-stage password check
- Network type: motorway, municipality, district road.
- Variable: limit, proportionality, actual speed, consequences.
- Support: primary statistics, not a headline.
- Scope: the victim population matches the population in question.
The most reliable approach separates the search from the password. First, a table of the section, accidents, speeds, and geometry. Only then a proposal for the limit. If the source cannot be opened, the claim is not elevated to a "massacre" simply because the number 150 sounds high.
12. The law measures obligation. It does not measure geometry.
Act No. 361/2000 Coll., in Section 18, imposes the duty to adapt speed, sets maximums, and allows for local adjustments upwards or downwards.[5] Technical conditions TP 145 describe the principles of 30 zones.[12] That is a regulation and a design manual. It is not the 85th percentile on a through-road that remained four lanes wide.
The ŘSD uses linear control and variable limits; on the pilot section D3, the system evaluates weather, traffic detectors, and operational status.[17][23] A variable sign can respond to conditions more accurately than a fixed maximum, provided the system is functioning and drivers obey the signage. Effectiveness must be evaluated on a specific section and cannot be automatically extrapolated to all motorways.
Active assistants can prevent a collision or reduce the impact speed, while passive elements protect the crew during a crash.[20] The level of protection varies by collision type and participant; therefore, improvements in crew protection cannot be translated into an equivalent benefit for pedestrians or cyclists without further data.
13. Risk is posed by both speed and its variance
The question "what maximum?" is important, but narrow. Higher absolute speed reduces reaction time and increases impact energy; meanwhile, speed differentials between vehicles alter the frequency of manoeuvres and conflicts.[16][19] On a motorway, it is therefore necessary to monitor the average, percentiles, and the speed distribution of passenger cars and HGVs. However, safety of a section cannot be calculated from variance alone without accident and exposure data.
In a built-up area, a pedestrian may suffer the consequences; on a rural road at night, a tree may be the deciding factor, and on a bridge, the wind. Telematics can capture certain conditions, whereas a fixed sign cannot. The sign, therefore, remains a necessary but crude tool.
More than two-thirds of drivers do not expect to be checked.[9] A limit without enforcement is a letter. A letter may civilise some people. It is not measured in 100 per cent. CDV and ERSO demonstrate this through compliance figures, not moral appeals.
14. The cost of a minute is not the cost of a crash
The driver counts time, the municipality counts noise, the hospital counts injuries, and the insurer counts damage. The claim "150 saves time, 30 saves lives" is therefore incomplete without knowing the road type, intensity, and actual change in speed.
A cheap minute on a motorway can be expensive if it increases the variance relative to a truck. An expensive minute in a 30 zone may be cheap if it reduces impact energy against a body near a school. Elvik shows that fatal outcomes respond more sharply to speed than minor ones.[11] That is why the Safe System focuses more strictly on the upper end, not proof for every campaign slogan.
The true cost of an adopted limit
Signage + geometry + enforcement + compliance + variance + vehicles + rescue + who is outside the car.
The costs and benefits of a limit can only be assessed with actual speed, compliance, intensity, and consequences. A 30 zone without street modifications may have less impact on the 85 percentile than a combination of signage, construction, and enforcement. In a 150 regime, variable signage must respond reliably to weather and traffic; current pilot data do not yet determine the long-term cost of accidents or the final balance of benefits.[23]
It is therefore useful to measure the cost per adopted section, rather than the cost per ideology. "Adopted" means that the limit, construction, and enforcement work together, and that accidents on that section are analysed by cause, not by television headlines.
15. What to choose for which road
The choice of measure should be based on the type of road and the control mechanism, not on political affiliation. The following table does not assign a winner; it suggests comparable sections and measurements for each objective.
| Requirement | First group of measures | The Decisive Test | An Unacceptable Shortcut |
|---|---|---|---|
| Protection by the School | 30 Zone + Construction | Actual Speed, Not Just the Sign | A Blanket Slogan Without Thresholds |
| Municipal through-road | Narrowing, Traffic Islands, Crossings | 85th Percentile Before/After | New 40 on a Wide Four-Lane Road |
| District Road in Winter | § 18, Guardrails, Avenues | Proportion of Disproportionality in Reports | Nationwide −20 km/h |
| Selected Motorway | Telematics, Possible 150s | Variance, Weather, Section Accidents | “150 = Massacre” Without Section Data |
| Nationwide Trend | Cars, Roads, Rescue | A Series of 2000–2025 | Attributing the Decline to a Single Amendment |
Foreign experience must be verified on Czech infrastructure. A German motorway is not the D1 and a Dutch 30 zone may not correspond to a Czech municipal through-road. The pilot should include wet conditions, darkness, lorries, and pedestrians, and allow for the conclusion that the sign alone is insufficient without structural modifications.
School streets, motorways, and third-class roads may require different regimes, as do tunnels and clear stretches of road. However, the driver must be able to clearly discern from the design and signage which regime is currently in effect.
16. A short section test that says more than a slogan
Before the pilot, a brief diagnostic can describe the geometry, traffic, speeds, and evaluation plan. Such a snapshot does not replace long-term accident assessment. Its aim is to determine the baseline, risk situations, and the data that the administrator will collect before and after the change.
Fourteen days from the sign to the section
- Days 1–2: Type of communication, accidents over 3–5 years, proportion of pedestrians and trees.
- Days 3–4: Measurement of actual speeds, 85 percentile, proportion within the limit.
- Days 5–7: Geometry: width, visibility, crash barriers, crossings.
- Days 8–10: Enforcement: radar, average speed cameras, expectation of checks.
- Days 11–12: Weather and telematics, if it is a motorway.
- Day 13: Protocols: how many "inappropriate" entries were below the table.
- Day 14: Pilot protocol: control section, tracking length, and revision date.
Fourteen days of preparation may suffice to set up measurements, but not to draw conclusions about fatal or serious accidents. For those, a longer comparable period is necessary, as is traffic intensity and, if possible, a control section; a low number of events means wide statistical uncertainty.
Three section tests
The first is the consistency between the sign and the road design. The second is the proportion of vehicles within the limit. The third is the composition of causes in the protocol. A product that provides an answer a week earlier is not necessarily better if, a year later, no one can determine whether the 85 percentile has moved.
Before changing the limit
- Distinguish between motorways, built-up areas, and district roads.
- Do not change the sign without an enforcement plan.
- For 30, demand road design, not just a sign.
- Demand telematics and section assessment from 150.
- Read § 18 as carefully as the table of maxims.
If possible, the assessor should not know which camp proposed the section. They monitor speeds, accidents, serious injuries, and pedestrians. Each failure is classified: signage, proportionality, geometry, enforcement, or vehicle.
Sections must be compared within the same period of the year and under similar traffic conditions. If only one section measurement exists, the pilot simultaneously tests enforcement, and this difference must be part of the interpretation.
The pilot must conclude with an operational rule: what goal the limit pursues, which data evaluate it, and when the review will take place. Cars, roads, and driving habits change; therefore, the measure must not remain without further scrutiny.
17. A sign is not enough without measurement and review.
The first generation of the debate sold the freedom of the steering wheel. The next generation sold zero deaths. Today's slogans sell something greater: the impression that a number on a post governs physics. This is why the competition is not just over 30 or 150. The competition is over which layer is permitted to speak for all the others.
The sharper the slogan, the higher the potential cost of oversight. Districts fit poorly into the motorway dispute. Pedestrians fit poorly into the argument about flow. Proportionality fits poorly into a radar that measures the maximum. People cease to distinguish their own section from the slogan in which it has been smoothed over.
Limits provide traffic with a common and enforceable rule. However, their proposal requires speed measurements, accident analysis, geometry, procedures for adverse conditions, and regular verification of the original justification.
The quality of a limit is determined neither by the lowest number nor the highest penalty. It must correspond to the geometry and users of the specific road, be enforceable, and allow for timely determination of whether the intended effect has actually occurred.
The moment we hang a sign, we choose a regulation. The moment we judge overall safety by it, we also choose a new structure of self-delusion. And then the question is no longer: "What number should be on the round sign?"
Before making a change, we should therefore ask: What speed are we actually measuring, what risk is the measure intended to reduce, and when will we have enough data for a review?
— Jiný Kontext