

A reimbursed application, an installed device and a saved megawatt-hour are three different results. Exhausted allocation can accompany smaller-than-planned savings, a project energy label need not match how the building is run, and an electric vehicle with no tailpipe emissions still carries emissions from electricity generation and from manufacturing the vehicle. Evaluation must therefore also count additionality, rebound and how impact is verified.
1. An allocation in which the application and the kilowatt-hour miss each other
Imagine a meeting on “green” subsidies. The director of the State Environmental Fund holds up a conference figure: by its fifteenth anniversary the New Green Savings programme had approved 412 thousand applications worth more than 91 billion koruna.[1] The environment minister adds the boiler-replacement programmes: 130 thousand households applied, replacement in 115 thousand of them cost more than 13 billion.[2] The industry deputy shows guarantees from the National Recovery Plan: the National Development Bank supported the purchase of 6 325 electric vehicles and 2 759 charging stations, guarantees amounting to 2.5 billion koruna.[3] The auditor from the NKÚ puts conclusion 20/19 on the table: for apartment buildings, by 31 December 2020 IROP had reached savings of 1.3 PJ against a plan of 3.1 PJ (41 per cent), NZÚ 0.4 PJ against a plan of 2.8 PJ (13.5 per cent).[5] The economist asks how much of that would have happened even without the subsidy. The technician asks whether, after insulation, the heating is set to 20 or to 23 degrees.
Behind the word “work” in the subsidy debate lie different ledgers. The fund tracks money and units, the ministry the replacement of equipment, the bank contracts, the NKÚ fulfilment of the plan as of the audit date, the economist additionality and the technician the actual operation of the building.
Exhausted allocation may be a correct figure for take-up, but it does not answer the question of energy or climate impact. That requires knowing the number and operation of devices, consumption, additionality, the emission factor and the gap between the actual building and the project.
The dispute should therefore not begin with whether to insulate, but with the choice of success indicator. An invoice, a project calculation, a meter and a tonne of CO2 describe different phases of a programme and cannot be swapped without a methodological conversion.
A reimbursed application is not a saved megawatt-hour. A unit in the register is not a tonne that did not leave through the chimney.
— Jiný Kontext
What we know about subsidy impact — and what we do not yet
We know: Public sources document the volume of support, the number of approved projects and, in audit 20/19, also fulfilment of the then savings plan for a specific segment of apartment buildings.[1][3][5] It can be assumed: technically correctly executed insulation or replacement of a heat source can reduce consumption or emissions, but the size of the benefit depends on the starting condition and on operation. From the cited materials we do not know: a uniform, measured net climate effect of all programmes after deducting weather, changes in behaviour and measures that recipients would have carried out even without support.
2. From the koruna to a real saving
The figure “91 billion for savings” denotes the scale of support, not automatically the amount of energy saved. Between payment and net climate effect lie the installed device, the projected impact, actual operation and a comparison with the scenario without the subsidy. A programme can therefore look different according to which phase we are measuring.
Five layers of one subsidy success
- Input: allocation and reimbursed koruna.
- Output: the number of façades, boilers, panels, vehicles.
- Projected impact: the saving from the PENB and from standard tables.
- Measured impact: electricity, gas and heat readings before and after, under the same pattern of use.
- Net climate effect: additionality, rebound, fuel, the grid emission factor, the life cycle.
The fund records the flow of money, the energy specialist the project calculation, the occupant influences operation and the power system the emission factor of a kilowatt-hour. The auditor then compares the plan with the result as of a given date. The claim “the subsidy saved energy” therefore needs to state whether it is a model, a meter reading, or a net effect against the scenario without support.
The division into layers determines where to turn when there is a discrepancy. If the allocation is exhausted and the reported saving lags the plan, the cause may be the setting of the target, the pace of delivery, the mix of projects, the calculation method or actual operation. The gap between the project label and consumption may arise from weather, the condition of the building, quality of workmanship or user behaviour. Without suitable operational data it is not possible to decide among these explanations.
Illustrative scheme: The chain between the climate and a press release runs through the koruna, the unit, the label, the meter reading and the net effect. A break in any link changes the meaning of success without changing the payment.
3. A programme must be able to detect its own error
Administrators usually look for the programme with the highest number of applications. That is reasonable, but incomplete. Equally important is what an error looks like, whether it can be recognised, how much overlooking it costs and whether the result is reversible. A badly filled-in form is a cheap error. A badly counted tonne in a national plan is expensive. An unused boiler can be replaced. Ten years of reporting without a meter reading sometimes cannot.
In inspection 20/19 the NKÚ did not say that insulation makes no sense. It said that by 31 December 2020 the programmes for apartment buildings had paid out roughly a third of the earmarked money and that reported savings had not reached the original plan.[5][6] This is an audit of one period, two programmes and the apartment-building segment, not proof that every koruna of NZÚ for family houses is lost.
| Type of failure | What it looks like | How to test it | What limits the harm |
|---|---|---|---|
| Input failure | Success = exhausted allocation | Separate koruna from GJ | Mandatory meter reading |
| Output failure | Success = number of units | Fuel, mileage, temperature | Check of operation |
| Model failure | PENB ≠ consumption | Before/after on the same building | Measured conditional payment |
| Additionality failure | Paying for what would have happened even without support | Comparison with the unsupported | Targeting those who would not build without the subsidy |
When choosing a programme it is not enough to compare the volume of money distributed. What matters is whether evaluation captures deviation from the plan and the deadweight of support. For a programme worth tens of billions, the number of approved applications must not remain the sole indicator of success.
The technical effectiveness of a measure is only part of the assessment. The programme must also make it possible to measure impact or to model it transparently, to estimate additionality and to convert energy into emissions. A smaller programme with a better evaluation may provide a more reliable figure than rapid take-up without these supports.
4. A projected result is not a consumption reading
Energy performance certificates are needed because they provide a standardised calculation of the building. In subsidy administration, supported measures work with project documentation, expert assessments and an energy evaluation according to the programme rules; this is not necessarily a reading of actual consumption before and after the intervention.[12][15] The calculation therefore cannot by itself be passed off as the consumption of a particular household. Actual operation is affected among other things by weather, the set temperature, ventilation and the number of users.
Every calculation contains hidden decisions. What temperature? What ventilation? What thermal bridges? What user profiles? The answer to any of these questions can change the promised saving. In 2020 the European Court of Auditors, on the energy efficiency of buildings, warned that a stronger emphasis on cost-effectiveness is still needed — that is, on what a koruna actually buys, not only on what a project promises.[13] This is a Union audit of cost-effectiveness, not of Czech PENB in particular; the direction of the reservation is the same.
What must be stated for reported petajoules
- Whether it is a plan, a calculation, or a meter reading.
- The population: apartment buildings, family houses, public buildings.
- The period and the date to which the saving is related.
- The specific subsidy in Kč/GJ and what is in it.
- Whether after the intervention the temperature, the heated area, or the number of occupants changed.
For the running of a programme a smaller set of houses with readings before and after, weather normalisation and a description of use can be useful. Such a pilot can reveal an error of method, but thirty purposively selected buildings are not a representative estimate of the whole programme. The project calculation and operational measurement should complement each other; each answers a different question.
5. Compare evaluations, not press releases
The market in subsidy titles can be described without a false ranking of winners. The following map does not say which programme is generally first. It shows what kind of work the individual layers assess and which failure the reader should look for during the debate.
| Programme / layer | Main working position | What to verify | Typical reason for choice in the report |
|---|---|---|---|
| NZÚ | Insulation, PV, heat sources | Whether the saving is PENB, or measurement | Volume of applications and billions[1] |
| Boiler-replacement programmes | Replacement of class 1 and 2 boilers | Fuel after the sustainability period | Number of units[2] |
| Electromobility Guarantee | Company BEVs and charging | Mileage and the grid mix | Number of vehicles and guarantees[3] |
| IROP apartment buildings | Renovation outside Prague | Fulfilment of the PJ plan | Union allocation[5] |
| NKÚ / ECA / OECD | System audit | Date, sample, definition of the saving | An independent cut through the report |
The table does not judge technologies as such. The same device can have a different impact according to operation and fuel. Its purpose is to show whether, besides purchasing the device, the programme also tracks its use and can later verify the result.
How to read the scheme: Input, output and impact are separate ledgers. The take-up of money cannot by itself be converted into saved energy or emissions.
6. New Green Savings: what the NKÚ actually calculated
Audit conclusion 20/19 covers measures to reduce the energy intensity of apartment buildings from IROP and from NZÚ in 2015 to 2020. By 31 December 2020 IROP reported 1.27 PJ, rounded in public communication to 1.3 PJ, that is 41.0 per cent of the original plan of 3.1 PJ. NZÚ in the Apartment Buildings sub-programme 0.4 PJ, 13.5 per cent of the plan of 2.8 PJ. Roughly 3.4 billion was paid out from IROP and 0.5 billion from the NZÚ apartment-building sub-programme, about a third of the then allocation for these calls.[5][6]
That is more important than a dispute over whether 14 per cent is “too little”. The figure measures fulfilment of the original savings plan as of a date, not the physical impossibility of insulation. The NKÚ also states that funds in NZÚ were provided efficiently in terms of the specific subsidy; in its response the Ministry of the Environment pointed to a delayed start, competition with IROP and to the fact that the forecasts were based on the older Green Savings programme.[6] This is a dispute about the ambition of the plan and about take-up, not proof that every house lies on its label.
The conference statistic of 412 thousand applications and more than 91 billion describes a different object: the entire history of NZÚ including family houses, as of the fifteenth-anniversary date.[1] Subsequent summaries speak of higher cumulatives. That is not necessarily a contradiction. It is a different date and a different perimeter of the programme. Anyone who adds boilers and vehicle guarantees here gets “over 110 billion” as a sum of families of policies, not as a single audited flow.
The original savings plan for apartment buildings is therefore not the same as later overall take-up of NZÚ. Mixing them is the same error as mixing the PENB and the meter.
7. A boiler in the protocol is not fuel in the firebox
The programme for replacing old boilers documented replacements of devices whose aim was to reduce emissions from local heating. As of August 2024 the Ministry of the Environment reported 130 thousand applications and more than 13 billion koruna for 115 thousand completed replacements. The estimate of remaining class 1 and 2 boilers was up to 150 thousand; the ministry at the same time said it did not have precise data.[2] The ban on operating these boilers has applied from 1 September 2024. The number of replacements documents the programme’s output, not by itself the size of the change in local emissions.
The cited public summaries report the number of replacements, but they do not provide a nationwide long-term series on the fuel and the mode of operation of each supported boiler. From these sources it is therefore not possible to confirm how the devices are used after five years. The ČHMÚ states that households account for more than 95 per cent of nationwide emissions of benzo[a]pyrene; this inventory share, however, does not determine the state of a particular firebox.[18] Replacement of a device and its subsequent operation are two different inspection questions.
The unreplaced remainder in the same valley can outweigh the benefit of the neighbours who did replace. That is not an argument against boiler-replacement programmes. It is an argument against a report that ends with the delivery note. The 2021 census gives the structure of household heating; it does not say what is burning in a particular firebox on a Tuesday evening.[7]
8. Electric mobility: a zero tailpipe is not a zero grid
The Electromobility Guarantee programme from the NPO supported 6 325 vehicles and 2 759 charging stations. Guarantees reached 2.5 billion koruna. The original target was 4 055 vehicles and 1 500 stations. Intake of applications stopped after the allocation was exhausted.[3][4] That documents the number of supported outputs and the financial instrument; the climate effect still requires data on the replaced vehicle, mileage and electricity.
Life-cycle analysis adds a part that the tailpipe does not show. A ČVUT paper reports for Czech electricity generation in 2024 approximately 340 g CO2eq/kWh against 432 g in 2019.[8][9] This average is not the same as the residual supply mix reported by OTE, nor the time profile of a particular charging session.[21] In the life cycle of electric vehicles the EEA distinguishes emissions from vehicle operation, electricity generation and battery manufacture; zero tailpipe emissions therefore do not mean zero emissions of the whole cycle.[10]
What needs to be tested
The first test concerns mileage. A ČVUT scenario analysis compares the Hyundai Kona in several powertrains and shows that the point at which the higher manufacturing emissions of a battery vehicle are offset by the operating saving changes markedly with battery size, the electricity emission factor and the compared powertrain.[9] This is not a universal Czech kilometre figure, nor a result of the Electromobility Guarantee programme; evaluating it would require data on the vehicles actually replaced and on mileage.
The second test concerns use. A company car with high mileage and night-time charging is a different object from a household’s second car with fifteen thousand kilometres a year. The third concerns the guarantee: 2.5 billion are guarantees, not the same as a grant paid out on a vehicle. Anyone who adds them to the 91 billion of NZÚ into one “success package” is adding different instruments.
If the programme supports a vehicle that hardly drives, its contribution to decarbonisation over its lifetime is questionable. That does not mean that an electric vehicle makes no sense. It means that evaluation must know the mileage and the kilowatt-hour, not only the registration plate.
9. Rebound is not fraud. It is behaviour after heat becomes cheaper
Energy economics identifies rebound: when the unit price of a service falls, part of the technical saving may return as higher use. A UKERC review summarises a wide range of estimates for household heating; the size depends on income, price, starting comfort and climate.[11][22] This is international literature, not a measured average of Czech NZÚ recipients.
An illustration, not a report: before renovation the family heated the living room to 19.5 °C and the bedrooms to 17 °C. After insulation and a heat pump the project promised a sharp drop in consumption. After three years the whole house is at 23 °C. The real saving is positive and substantially lower than the label. The report may show the full theoretical saving. In physics what shows is the comfort the house can afford for the first time.
That is not necessarily abuse. It is a predictable reaction to cheaper heat. A programme that does not count it is not measuring impact. It is measuring a hypothesis about behaviour that did not occur. Jevons’s paradox in its strong form — that efficiency raises consumption above the original level — is a different, stronger thesis and is not evidenced for Czech insulation from the available audits. Weaker rebound yes: as a mechanism that evaluation should look for, not as an invented Czech percentage.
10. Deadweight: a subsidy may pay for what would have happened anyway
The second mechanism is additionality. Boomhower and Davis showed on California data how to measure inframarginal participation: the share of those who would have bought the measure even without support.[19] The OECD in the Environmental Performance Review of the Czech Republic 2023 points to the need for more targeted and evaluated instruments, not to every koruna being wasted.[14]
A Czech “40 to 55 per cent of PV recipients would have built anyway” is not in this text as a measured figure. The cited sources contain no econometric estimate of NZÚ additionality for this cut. A foreign percentage therefore cannot be transferred onto Czech recipients. If some households would have carried out the measure even without support, without an estimate of this deadweight it is not possible to determine how large the climate effect really is additional relative to the scenario without the subsidy.
NZÚ Light and targeting low-income households can increase the availability of measures for groups with limited capital.[1][15] The public summaries cited in the article do not themselves, however, give a causal comparison with what the same households would have done without support. The number of applications therefore speaks to use of the programme, not by itself to additionality.
11. An application is the start of the audit trail
Before the subsidy portal the office had to trust an invoice. With a digital application it checks something more complicated: whether the document exists, whether it describes the same building, whether the calculation supports the promised saving and whether after three years it still holds. The application is navigation towards evidence. It is not automatic proof of consumption.
The figure of 412 thousand applications, 13.5 per cent of the then plan for apartment buildings and 6 325 supported cars comes from different programmes, periods and layers of assessment. They cannot be added into the conclusion “green policy delivered on climate”, because they combine input, fulfilment of a specific plan and output without a figure for mileage.
Four-step check of a report
- Existence: primary document, date, institution.
- Perimeter: which programme, which population, which period.
- Support: is it a koruna, a unit, PJ from a PENB, or a meter reading?
- Scope: does the unit match the unit with which the argument is made.
The most reliable procedure separates searching from celebrating. First a table of claims, sources and limitations. Only then the press release. For every petajoule it is recorded whether it was calculated or measured. If the source cannot be opened, the claim is not promoted to a tonne of CO2 merely because the number is round.
12. The energy-performance law does not measure the occupant
Act No. 406/2000 Coll. and the related decrees regulate certificates, audits and duties in larger changes to completed buildings.[12] Standardised energy assessment makes it possible to compare buildings, but it does not directly reproduce the actual behaviour of every household. That appears only in operational data, which moreover need to be cleaned at least of weather and changes in use.

NKÚ inspection 20/19 found, for the measures tracked for apartment buildings, lower fulfilment of the original plan than the programmes had assumed.[5][6] This single audit cannot be passed off as a summary conclusion about industry, state buildings or all later calls. It does, however, show why every figure must state the perimeter, the date and the method of calculation.
In the Union framework there is added EU ETS 2 for buildings and road transport: a carbon price is meant to complement the subsidy.[20] This is not a finished Czech substitution programme. It is a different instrument, which measures fuel by price, not by application. The signpost for the debate is whether a blanket subsidy, a targeted loan, or a carbon price better hits additionality. The answer is not in the number of stamps.
13. What in the programme remains unmeasured
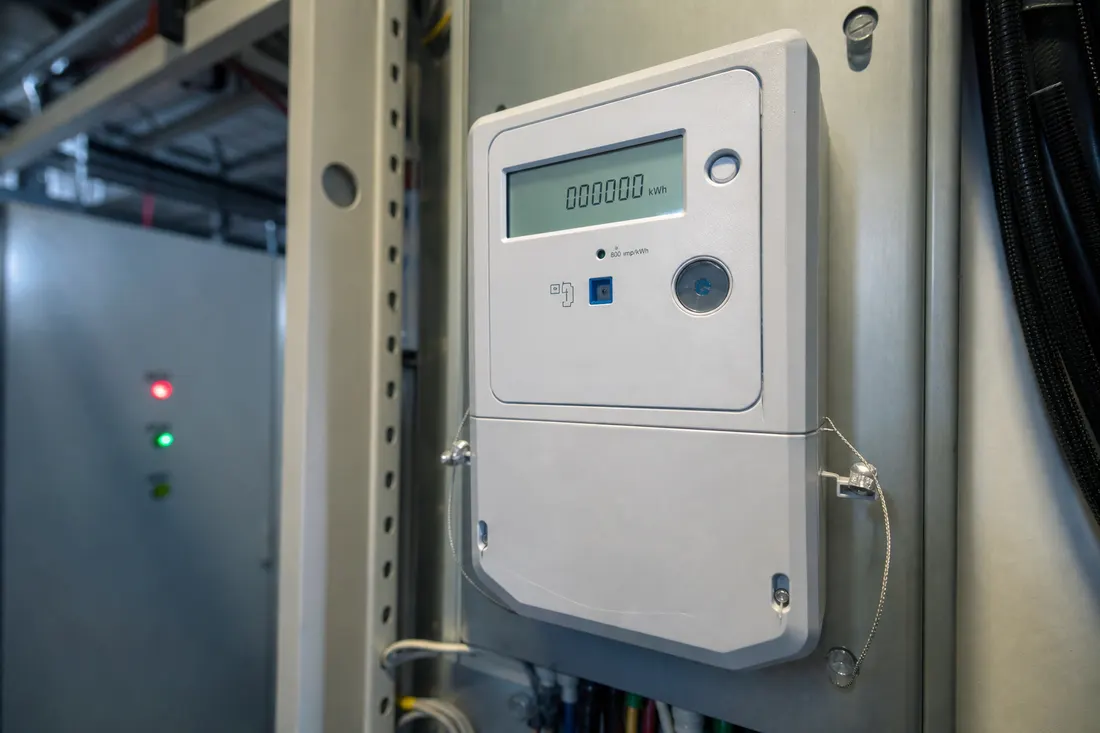
The question “how much have we handed out?” is important, but narrow. The administrator also needs to know where meter readings are stored, for how long, who may see them, whether before/after series are kept and whether fuel is checked after the sustainability period. “We have 412 thousand applications” does not mean “we have 412 thousand measured savings”.
Differences among programmes are marked in the official materials. NZÚ, boiler schemes, NRB guarantees and IROP have different inputs and different outputs.[1][2][3][5] It does not follow that each is pointless. It follows that success cannot be judged by the logo without the name of the layer.
Evaluation should track the flow from the public koruna through the project, construction and operation to energy and emissions. At each step the result can be changed by quality of delivery, behaviour, fuel or the grid; without this trail a net climate effect cannot be derived from an application.
The ECA stresses cost-effectiveness and the OECD the need for better targeted and evaluated instruments.[13][14] The cited materials at the same time do not document a uniform national database from which consumption before and after the intervention could be calculated for all the programmes listed. That is a limit of this article and of public comparison, not proof that no operational data exist.
14. The price of a koruna is not the price of a tonne saved
The market uses several price languages at once. Policy pays a billion. The household pays the top-up. The climate pays a tonne that was not deducted. An agent can make dozens of applications even though the saving is one and that one is on paper. Direct comparison of programme price lists without knowing the layer is therefore misleading.
A cheap subsidy per unit can be expensive per tonne if deadweight is high. An expensive subsidy for a low-income household can be cheap per tonne if, without it, heating would never be clean. For apartment buildings the NKÚ reported a specific subsidy of 2 681 Kč/GJ for IROP and 1 271 Kč/GJ for NZÚ; the Ministry of the Environment argued that the latter is favourable.[5][6] The specific subsidy measures the koruna per reported gigajoule. It does not measure whether the gigajoule exists in a meter reading.
The real price of an accepted result
Subsidy + top-up + administration + inspection + rebound + deadweight + the grid emission factor + the price of a mistaken report.
Cost-effectiveness can be judged only when the impact is estimated or measured by a transparent method and its uncertainties are stated. A meter reading is strong support for building operation, but a model calculation can also be valid if it has reasonable inputs, a correction of conditions and verification against data. Allocation alone is not enough for comparison.
Fluctuating conditions also belong in the evaluation. Building consumption before and after the intervention needs to be normalised for weather and use. For electric vehicles a hypothetically low mileage would reduce the operating benefit relative to manufacturing emissions; the cited programme statistics, however, do not report the actual mileage of supported vehicles, so this magnitude cannot be quantified here.
It is therefore useful to state the cost per verified or transparently modelled GJ or tonne, not only the cost per application. For the result it must be clear whether it comes from measurement, a normalised estimate or a project calculation and how temperature, mileage and other variables are treated.
15. What to choose instead of a blanket stamp
The name of the programme is not a suitable first criterion. The following table assigns to each objective a control mechanism and proposes comparing two instruments on the same objects and in the same period; it is not a ranking of technologies.
| Need | First group of instruments | Decisive test | Unacceptable shortcut |
|---|---|---|---|
| Heat saving in the house | NZÚ, IROP, loans | Reading before/after, same use | The label as consumption |
| A cleaner boiler in the valley | Boiler schemes, NZÚ Light | Fuel after 3–5 years | The delivery note as emissions |
| Company kilometres | Guarantee, tax, company fleet | Mileage and the electricity mix | Tailpipe zero = climate zero |
| Low-income households | Targeted pre-financing | Additionality against a control | A blanket bonus for the well-off |
| Systemic decarbonisation | ETS 2, a standard, measurement | A tonne per koruna | Volume of allocation as a verdict |
Czech evaluation must add to the Union cost-effectiveness audit local operation: winter consumption, fuel in the boiler and the mileage of supported vehicles. If public materials contain only an invoice, the assessment should admit this limit instead of calculating a non-existent meter reading.
Different target groups may require targeted pre-financing, a guarantee or a carbon price. Using more than one instrument is defensible if the report keeps their inputs, outputs and impacts separate.
16. A short audit that says more than the number of applications
A running audit need not wait ten years, nor anticipate the cancellation of a programme. On a smaller, described sample it can verify the method, find the gap between project and operation and prepare a more representative long-term evaluation.
Eight steps from impression to decision — as an operational minimum, not as a substitute for an NKÚ audit
- Separate input, output and impact into three columns.
- For a sample of buildings request a reading before and after.
- Record temperature, floor area and the number of persons.
- For boilers check the fuel, not only the boiler label.
- For vehicles check mileage and the source of electricity.
- Estimate additionality at least by comparison with the unsupported.
- Calculate Kč per accepted GJ, not per application.
- Publish what the sample does not measure.
Three tests of real impact
The first is temporal: when was the intervention and when was it measured? The second is about origin: is it a PENB, an invoice, or a meter? The third is contradictory: is there an independent source that challenges the promised saving? A programme that answers a billion earlier need not be better if after five years nobody can find out how much energy remains.
Before launching the next call
- Write which layer is the success indicator.
- Condition part of the payment on a meter reading.
- Separate low-income households from a blanket transfer.
- For cars require mileage, for boilers fuel.
- Set a date when the plan will be opened again.
The evaluator should if possible not see only the press release. For buildings they track GJ. For boilers dust and BaP. For cars tonnes at a given mix. Each failure is classified: model, behaviour, fuel, additionality, or under-absorption.
Comparison of programmes requires the same period, a climate correction and a description of use. A project calculation and direct measurement have different uncertainty; if we put them side by side, the difference of method must be visible.
The output of evaluation should be a rule for using the programme: what impact it tracks, which data support it, who checks the method and when revision comes. Tariffs, the energy mix and prices change, so a conclusion without a date quickly goes stale.
17. Trust arises only when impact can be traced
The first generation of green programmes sold boilers and façades. The next generation the number of applications. Today’s reports sell something larger: the impression that the climate is being managed because the allocation disappeared from the account. That is why the contest is not only over the best technology. It is over which metric is allowed to speak for physics.
The more convenient the report that arises, the higher the cost of leaving it can be. Petajoules are hard to convert back into meter readings. Cars are hard to convert back into tonnes. People stop distinguishing their own consumption from the programme in which they reported it.
Insulation, heat pumps and electric vehicles can bring substantial benefit. Public support, however, needs transferable data, a documented conversion from the koruna to energy or emissions, and a procedure for when the project calculation disagrees with operation.
The quality of a programme is not determined by the highest number of applications nor the fastest take-up. What decides is whether its declared impact matches actual operation and whether deviations are visible, measurable and fiscally manageable.
At the moment when the state pays an invoice, it is choosing a unit. At the moment when it reports the unit as a tonne, it is also choosing a new structure of accountability. And then the question is no longer: “How much have we handed out?”
At the next call let us therefore ask: Which impact can we document, what uncertainty remains in it, and who decides when operational data disagree with the project?
— Jiný Kontext