

A figure on air quality has meaning only with the substance, the place, the period and the reference value. The national average may fall while a traffic site remains loaded. A station may measure accurately yet not represent the street where a person moves; a spatial model in turn may fail to distinguish a school from the neighbouring arterial road. Meeting an EU limit is moreover not the same as reaching the stricter WHO guideline.
1. Two standards, one air
Imagine a ministerial meeting on air. An official holds a table from the European Environment Agency: the average urban exposure indicator for PM2.5 in Czechia fell from 26.6 µg/m3 in 2009–2011 to 12.2 µg/m3 in 2023, that is by 54.1 per cent.[1] A meteorologist from the Czech Hydrometeorological Institute adds that in 2024 the annual PM2.5 limit was not exceeded at any station with sufficient data, for the second time in the history of measurement since 2005.[3] A pulmonologist objects that the WHO annual guideline for PM2.5 is 5 µg/m3 and that 12.2 µg/m3 is still a 2.4-fold multiple.[2] The mayor of a valley municipality shows a winter morning when smoke from chimneys lies in the basin, while the nearest station reports a good index. A Prague councillor shows Legerova: annual average NO2 36.7 µg/m3, under the current EU limit of 40, but almost four times the WHO guideline.[11][2]
The word “clean” here conceals several different assessments. The official tracks a legal limit, the meteorologist the representativeness of the network, the doctor a health-derived WHO guideline, the mayor a local inversion and the councillor a traffic site. Each yardstick has a different spatial and legal meaning.
Meeting the annual PM2.5 limit is valid information about a legislative assessment, not a complete description of exposure. A conclusion for the public must also state the health guideline, the station type, the substance tracked and whether the figure represents a park, a traffic street or a valley with local heating.
When comparing, it is first necessary to determine whether we are assessing a long-term trend, a particular street, a modelled area or the relationship to the WHO guideline. A background station, a street canyon and a kilometre-scale model are not interchangeable sources for the same question.
A station measures a point. A person breathes a route. An average of points is not the air in the lungs.
— Jiný Kontext
What measurements and models show — and what we do not know from them
We know: Stations describe concentration at a particular place and time; models fill the space between them. Station type, interval and model resolution determine for which comparison the figure is usable.[3] One may assume: a well-validated model will capture a spatial trend even where no station stands. We do not know without local measurement or a more detailed model: the precise concentration on a particular pavement, an individual’s personal dose, or every short peak in a street.
2. What determines the meaning of one concentration
An index in an app is the result of a choice of substance, station, time interval, aggregation and comparison value. Two apps can therefore, even from the same source, create a different message, and the same figure may be suitable for an annual trend but unsuitable for today’s street.
Five layers of one air-quality figure
- Substance and metric: PM2.5, PM10, NO2, benzo[a]pyrene; annual average, daily maximum, population-weighted exposure.
- Place of measurement: background, traffic or industrial station; inlet height; distance from the roadway and chimneys.
- Time: an hour of inversion, the heating season, an annual average, a three-year AEI indicator.
- Aggregation: a point, a 1 km square, a region, a state, an urban population.
- Reference value: the current EU limit, the limit from 2030, the WHO guideline, unit carcinogenic risk.
The CHMI network is the basis of official assessment, but an app may choose a station of a type that does not match the user’s location, and a spatial model may smooth a local contrast. The yearbook for 2024 at the same time reports meeting of the annual PM2.5 limit at assessed stations and 7.3 per cent of inhabitants on 1.3 per cent of the territory with above-limit benzo[a]pyrene.[3] A general judgment of “clean air” without the name of the substance thus joins two different findings.
Without this cut, in a contradiction one does not know where to reach. If the national average has fallen and winter in a valley has remained dirty, spatial selection may have failed, not the laboratory. If a station by a road reports high NO2 and a park three hundred metres away does not, that is not fraud. It is the geography of emissions. If the EU limit holds and the WHO does not, we are not comparing cleanliness. We are comparing two different contracts.
Illustrative scheme: The chain between the lungs and a press release runs through substance, station, interval, aggregation and threshold. A break in any link changes the meaning of the number without the measurement itself changing.
3. A report must name its blind spot
Readers usually look for the report with the highest share of limits met. That is reasonable, but incomplete. Equally important is what the place the report does not see looks like, whether it can be recognised, how much overlooking it costs, and whether it is a reversible peak or a season in a valley.
For 2022 the EEA estimated in Czechia 6 884 premature deaths attributable to PM2.5 against 13 100 in 2005, a fall of 48 per cent.[5] This is a health-risk assessment according to the WHO Europe methodology, not a clinical diagnosis of an individual and not proof that under the EU limit the risk disappears. The decline is real. Zero is not.
| Type of failure | What it looks like | How to test it | What limits the harm |
|---|---|---|---|
| Confusion of references | An EU limit met, a higher value than the WHO guideline | Compare the same concentration with both values | Separate legislation from the health guideline |
| Failure of place | A background station representing a canyon or a basin | Station type, distance, inlet height | Traffic and local measurement |
| Failure of time | An annual average hiding inversion weeks | Daily and hourly series in the heating season | A smog warning system |
| Failure of substance | Clean PM2.5, high benzo[a]pyrene | Track PAHs and local stoves, not only dust | Fuel, boiler, combustion control |
Political assessment therefore cannot stop at nationwide meeting of limits. It must also show situations that the network or the model distinguishes more poorly. Mountain background, a traffic canyon and a municipality with local stoves have different sources and different groups of inhabitants, and one average will not split their exposure.
When assessing the network, besides technical quality it is necessary to watch the visibility of local extremes, time resolution and the representation of vulnerable groups. A clearly labelled station type may carry more information for a local decision than a smooth spatial map that does not distinguish a street contrast.
4. An ambient average does not describe every place
Indicators are needed because they replace part of impressions with a repeatable series. The problem arises the moment one number begins to stand for all the air. The EEA builds the Average Exposure Indicator on a three-year average of urban background stations. At the same time it thereby defines what it does not measure: a traffic hot-spot, a village inversion, an hourly peak, or benzo[a]pyrene.[1]
Every test contains hidden decisions. Which stations enter the average? What type? What period? What threshold? The answer to any of these questions can change the sentence in a press release. In 2024 the CHMI defined areas with exceedance of ambient limits excluding ozone on 1.3 per cent of the territory, where approximately 7.4 per cent of inhabitants live; after including ozone 1.4 per cent of the territory and 7.5 per cent of inhabitants. The delineation is driven primarily by benzo[a]pyrene. Annual PM2.5 and NO2 at stations did not exceed the limits.[3]
What must accompany a claim of clean air
- The precise substance, metric and unit.
- Station type and its representativeness, not only the name of the municipality.
- The period: hour, day, year, three-year AEI.
- The threshold: EU now, EU 2030, WHO 2021.
- Known gaps in the network: small settlements, valleys, breathing height.
For a local decision a map that distinguishes station type and sources in the municipality is useful. A short winter campaign can capture an inversion episode, but it is not representative as an annual average. The national indicator and local measurement therefore complement each other; each describes a different scale.
5. Compare stations, not slogans about clean air
The network can be described without a false podium of winners. The following map does not say who “is right about the air”. It shows what kind of work the individual layers do, what context they bring and which failure the reader should look for on purpose.
| Layer | Main working position | What to check | Typical reason for use |
|---|---|---|---|
| CHMI urban background | A city average outside a canyon | Whether it is not being passed off as a street | A long-term trend |
| Traffic station | An artery, a canyon, a junction | Inlet height and distance from the roadway | NO2 and dust from traffic |
| Industrial station | Steelworks, chemicals, a site | What has changed on the site | A local source, not a “region” |
| CAMx / EMEP / CAMS model | Coverage of white spots | Resolution and input emissions | A spatial map, not a microclimate |
| Community sensor | Density in the municipality | Calibration against a reference | A signal, not an official limit |
The table does not judge the quality of measurement. It shows for what purpose different types of stations and models serve. A background figure should therefore not by itself be used as an estimate of a child’s exposure in a traffic canyon.
The best figure on air is determined by the price of its blind spot. A decision joins impact, the chance of detection, the reversibility of a peak and who bears the consequences. Neither the position nor the size of elements in the scheme expresses a score; the scheme shows questions that must be answered together.
How to read the scheme: Background, traffic, industry, model and sensor provide different cuts of the same air. Their figures can be combined only with a statement of space, time and method.
6. An EU limit is not a WHO guideline value
Air-quality assessment uses two different references. An EU limit is a legally enforceable value. A WHO guideline is a health-derived value for population protection, not a boundary below which risk is automatically zero. Directive 2024/2881, effective from 10 December 2024, sets for 2030 an annual limit PM2.5 10 µg/m3 and NO2 20 µg/m3; until then the previous values of 25 and 40 are used. The target value for benzo[a]pyrene remains 1.0 ng/m3.[8] In 2021 the WHO recommended annual AQG of 5 µg/m3 for PM2.5, 15 µg/m3 for PM10 and 10 µg/m3 for NO2.[2]
| Substance | Annual EU limit (until 2030 / from 2030) | WHO 2021 guideline | What the number can say in Czechia |
|---|---|---|---|
| PM2.5 | 25 / 10 µg/m3 | 5 µg/m3 | AEI 12.2 µg/m3 (2023) is under the old limit, 2.4× above WHO[1][2] |
| PM10 | 40 / 20 µg/m3 | 15 µg/m3 | Annual limits at stations in 2024 met; daily exceedance on 0.003% of the territory[3] |
| NO2 | 40 / 20 µg/m3 | 10 µg/m3 | Stations met the 2024 limits; traffic arteries remain well above WHO[3][10] |
| Benzo[a]pyrene | 1.0 ng/m3 | 0.12 ng/m3 as a reference risk level | 7.3% of inhabitants on above-limit territory (2024)[3][21] |
If a state report notes that limits are being met, that means meeting of a legislative standard. It does not mean reaching the value that the WHO recommends for long-term exposure, nor zero health risk. It does not follow that the CHMI measures badly. A legal limit and a health guideline have a different function.
For benzo[a]pyrene the distinction is still more important. The value 0.12 ng/m3 is not a “WHO limit” in the same sense as the annual AQG for PM2.5. It is a reference concentration derived from unit carcinogenic risk in older European WHO materials; the new EU directive uses it in the assessment system.[21][8] Comparing 1.0 against 0.12 therefore does not place two equally standing limits side by side.
According to the EEA overview, in the assessed year still about 95 per cent of the EU urban population was exposed to a PM2.5 average above 5 µg/m3.[6] Czechia is not an exception in that. Meeting of an EU limit can therefore occur earlier than reaching of the WHO guideline value.
7. A background park is not a street canyon
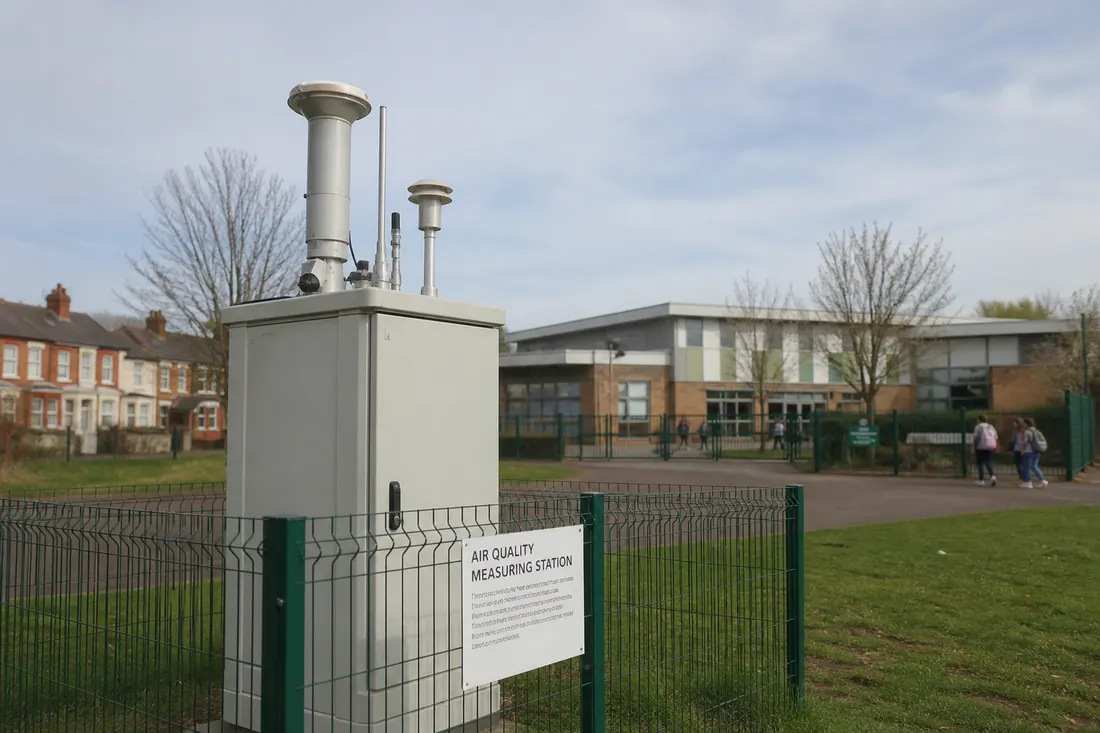
The state ambient-monitoring network is technically advanced. Its placement is governed by rules of representativeness, not by the aim of measuring every junction. Urban background stations represent a broader urban background outside the immediate influence of a particular source; traffic stations, for example Legerova in Prague and Českobratrská in Ostrava, track loaded roads.[3][11] The network therefore does not by itself give a point measurement for every municipality, street or valley.
In 2024 the CHMI measured NO2 with passive samplers in streets and by schools in Prague and Ostrava. In Prague the campaign had at 11 of 17 traffic sites an estimate of the annual average higher than 40 µg/m3. It reported the highest values for upper Ječná by Sokolská at 58 µg/m3, V Holešovičkách 57.3 µg/m3 and Plzeňská 57.2 µg/m3. At background sites by schools — in courtyards or development approximately 100 metres from an artery — concentrations were 2.2 times to 2.5 times lower; they nevertheless moved at the level of the future limit of 20 µg/m3 or above it. The deviation of the passive samplers from the reference method was 3.7 per cent at Legerova and 9.1 per cent at Českobratrská.[10] These are results of a measurement campaign, not in themselves a legal evaluation of the whole Prague network nor a measurement of every municipality.
That is not proof that background stations lie. It is proof that they measure different air. Anyone who takes a park as a proxy for a canyon does not make an error in chemistry. They make an error in geography.
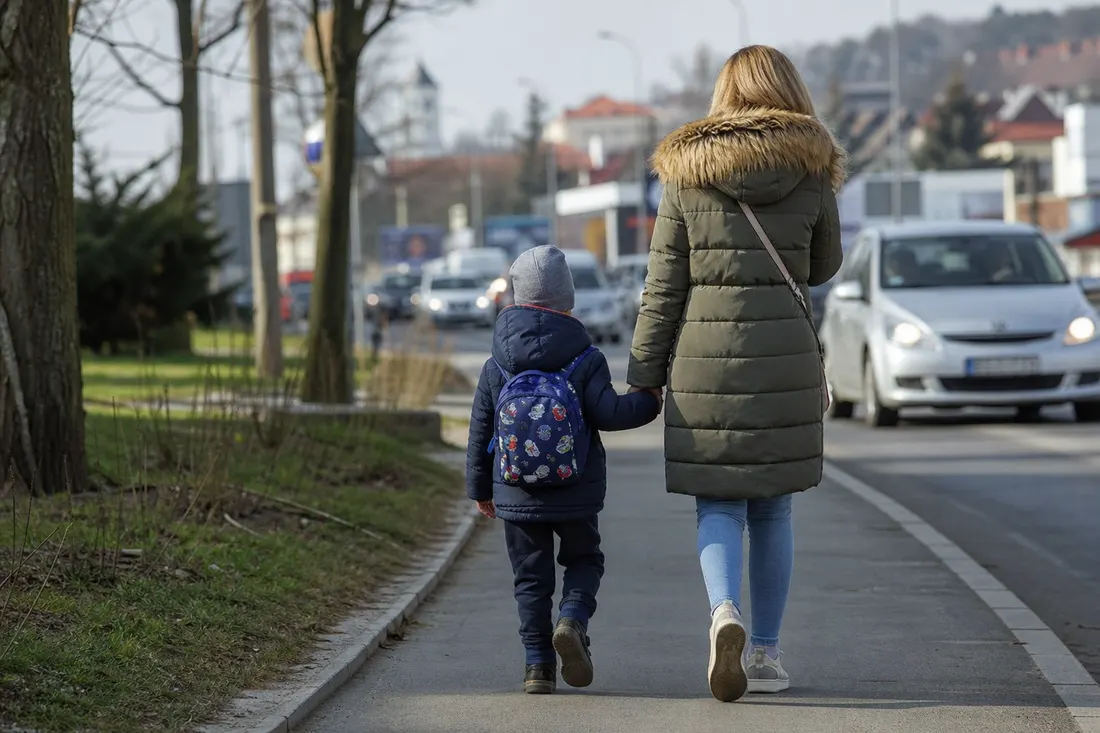
Personal exposure is also affected by height, a person’s movement, distance from the roadway and time spent in the place. From the figure of one stationary station it is therefore not possible, without more data, to derive the precise dose of a child in a pram or of an adult pedestrian. This is not an error of the station, but a difference between ambient measurement of a locality and personal exposure.
8. Model resolution has its limits
Because it is not possible to measure on every corner, the CHMI supplements stations with modelling and uses various model inputs; the European context is also provided by EMEP and Copernicus CAMS.[15][16] Spatial resolution differs among products and tasks. A spatial model may describe an area or a trend well, but without a sufficiently fine grid and suitable inputs it may fail to distinguish the contrast between an arterial road, a school and a courtyard, or the flow in a street canyon.
The CHMI says this openly for benzo[a]pyrene: the estimate of fields has among the mapped substances the greatest uncertainty, among other reasons because more extensive measurement in small settlements that would represent the influence of local stoves is missing. Station rotation is therefore used so that over several years more localities are measured.[3] That is an honest limit. It is not a reason to throw the model away. It is a reason not to read a kilometre map as a street.
What needs to be tested
The first test concerns resolution: what grid, what emissions, what weather. The second concerns validation: where the model sits on a station and where it diverges. The third concerns use. A model is good for delineating areas and trends. It is bad as the sole proof that a particular crossing by a school is “in order” because the square has the colour of the limit.
With a large corpus of data, for a particular local decision a suitably placed station with a clearly stated type may be more useful than a smooth map of a whole region. A nationwide map has a different purpose: it shows spatial differences, but it can smooth the contrast of one street. From the map itself one cannot infer an intention to hide something.
9. Benzo(a)pyrene: a household chimney is not a power-plant chimney
According to the national emission inventory, the household sector — heating, water heating and cooking — was in 2023 the dominant emission source of several tracked substances: it accounted for 96.6 per cent of benzo[a]pyrene emissions, 81.3 per cent of PM2.5 and 63.7 per cent of PM10. Public energy was a significant source of arsenic and SO2, traffic of NOx emissions.[3] An emission share for the whole republic does not, however, itself determine local concentration, personal exposure or the source’s share of toxicity and health burden.
The burning of coal and unsuitable wood in older boilers produces polycyclic aromatic hydrocarbons. Benzo[a]pyrene binds to fine particles and IARC classifies it as carcinogenic to humans.[19][20] Studies in the Moravian-Silesian region linked exposure to a mixture of dust and PAHs with biomarkers of genotoxicity; these are particular samples and periods, not proof that every municipality in the republic carries the same risk.[12] Long-term PM2.5 cohorts show a relationship to mortality even at concentrations under older limits; Pope and colleagues summarise more than 25 years of these studies.[13]
At the industrial station Ostrava-Radvanice ZÚ the annual average of benzo[a]pyrene fell from 5.2 ng/m3 in 2023 to 1.6 ng/m3 in 2024 after the curtailment of primary steel production at Liberty Ostrava. In 2025 provisionally 1.3 ng/m3.[4] The decline is real and is tied to a particular source. It is not proof that local stoves in the agglomeration have disappeared. On the contrary: the CHMI states that local heating has long accounted for more than 95 per cent of nationwide benzo[a]pyrene emissions.[4]
The curtailment of primary steel production can explain part of the change at a particular industrial station, not automatically the development of the whole agglomeration. Local stoves and other sources must be assessed separately; neither an emission inventory nor a single station by itself documents their local contribution in every basin.
10. Ostravsko and Legerova fail differently
Aggregated statistics erase hotspots because they add up different mechanisms. The Ostrava–Karviná–Frýdek-Místek agglomeration remains according to the CHMI the most loaded area in the long term; in 2024, 80 per cent of its inhabitants were exposed to above-limit concentrations.[3] Above-limit here is driven primarily by benzo[a]pyrene, not annual PM2.5 at stations. That is important: the same percentage could in another city mean traffic. Here it means a mixture of steelworks, stoves and transboundary background.
Prague has a different profile. The annual NO2 average at the station Prague 2-Legerova of 36.7 µg/m3 remains under the valid limit of 40 µg/m3, but above the WHO guideline of 10 µg/m3.[11][2] The passive campaign showed still higher values at some traffic sites.[10] For their interpretation it is necessary to distinguish traffic emissions, urban background and local flow conditions; the concentration itself will not determine each source’s share.
Two similar indexes can mean different air. Index 2 in a park and index 2 in an app that draws from the park while you stand on an arterial road are not the same measurement. They are the same number transferred to the wrong place.
Two similar indexes can mean different air
Take two illustrations, not a report. Locality A: an official station in a hospital grounds on a rise, greenery, background type. The index reports very good quality. Locality B, two kilometres as the crow flies: a housing estate in a valley, a junction, family houses with boilers. During a winter inversion the PM2.5 concentration here can exceed the background several-fold; the order of inversion peaks in basins with solid fuels is known from campaigns and from rotating stations, not from the year-round average of every municipality.[3] Parents in B open an app linked to A and walk with a pram in the belief that they are breathing the same thing.
The error is not in sensor A. The error is in the transfer of representativeness. Two kilometres on a map are not two kilometres in the air when a hill and an inversion lie between them.
11. An app must show where it takes the figure from
Before the smartphone a person had to trust a window and a nose. With an index they check something more complicated: whether the source exists, whether it is the right type of station, whether it speaks of the same hour and whether the conclusion “you may air the room” really follows from the point the app used. An index is navigation to a measurement. It is not automatic proof about a street.
The republic’s annual average, a background-station figure and an hourly peak in a canyon can all be correct, but they relate to a different space and time. A recommendation to run along an arterial road therefore cannot rest on a nationwide or background figure without local measurement.
A four-step check of the index
- Existence: where the number is from, which station, which ID.
- Type: background, traffic, industry, model, or a community sensor.
- Support: does the interval fit — now, today, this year?
- Scope: does the place fit the place where you breathe.
The community network Sensor.Community densifies the map with cheap PM sensors.[14] It is a useful signal of the gradient between streets. It is not an official ambient limit. Calibration, humidity and placement on a balcony change the number. A research product is good when it shortens the path to a check, not when it replaces the check.
12. The yearbook describes a trend, not a personal dose
The CHMI yearbook for 2024 is sober: concentrations of most substances are falling, PM2.5 and PM10 at stations did not exceed the limits, benzo[a]pyrene and ozone did so on part of the network. The year was extraordinarily above-normal in temperature, an average of 10.3 °C, a deviation of +2.0 °C from the 1991–2020 normal; a warmer heating period reduces fuel consumption. Emissions are also falling. In the Ostrava region the curtailment of Liberty showed.[3] All of this is true of what the yearbook measures.
For a local reading further figures also matter: according to the yearbook, 80 per cent of inhabitants of the O/K/F-M agglomeration lived in areas with exceedance of at least one ambient limit and 7.3 per cent of the republic’s inhabitants on territory with above-limit benzo[a]pyrene.[3] The Prague passive campaign moreover measured at part of the traffic sites estimates of the annual NO2 average above the numerical level of the valid limit; the campaign itself, however, does not replace a legal assessment of the station network.[10]
Act No. 201/2012 Coll. imposes limits, information and a smog warning system.[9] The new directive will from 2030 add harder numbers and a stronger right to information.[8] Neither the act nor the directive will turn a background station into a measurement of a pram. They change the state’s duty. They do not change the physics of dispersion.
A long series is like a long context for a model: the whole republic fits into it. It does not follow that every sentence in the series is used equally. The decisive paragraph may lie in the chapter on benzo[a]pyrene, while the headline cites PM2.5.
13. Who remains outside the average
The question “has the average fallen?” is important, but narrow. An organisation must also know who remains in the tail of the distribution: children by an artery, households with a class 1 and 2 boiler, an estate under an inversion, an industrial quarter downwind. The average may fall because the middle has been cleaned, while the tail holds the toxicity.
The EEA states that Czechia is on the path to the target of reducing premature deaths attributable to PM2.5 by 55 per cent by 2030 against 2005; the decline to 2022 was 48 per cent.[5] The target is population-level. It does not describe whether the gain has been evenly distributed between a park and a basin. It does not follow that the average is worthless. It follows that fairness of exposure is a different metric from meeting a limit.
In the European Union a legal shift is added. Directive 2024/2881 brings limits closer to WHO guidelines, but does not reach them: PM2.5 10 against 5 µg/m3 and NO2 20 against 10 µg/m3.[8][2] The WHO guideline value has remained stricter. Czechia can therefore in 2030 meet the new EU limits and at the same time be above the AQG; both figures answer a different question.
Local assessment should besides the average contain station type, fuel, traffic, inversions and places where vulnerable groups stay. Only this combination will show whom the nationwide trend represents well and whom it does not.
14. The price of a limit is not the price of health
Public policy uses several languages at once. A press release tracks meeting of a limit, a health assessment population risk, a municipality emission sources and traffic policy the operation in the streets. The claim “we are clean because the limit was met” therefore, without stating the substance, the place and the reference value, says too little.
A national average will not quantify the health impact of local hotspots. In 2024, 7.3 per cent of inhabitants lived on territory with above-limit benzo[a]pyrene and the Legerova station reported NO2 close to the valid limit.[3][11] The choice of measures therefore requires knowledge of the substance, the place and the source; from the concentration in one street one cannot without source analysis determine whether traffic, heating or their combination decides.
The conclusion is more complete when, besides meeting of a legal limit, it also states a comparison with the WHO guideline and the limits of spatial representativeness. Such a reading can change the order of priorities: a region with a low background and local hotspots is not the same as a region with an evenly distributed concentration, even if they have a similar average.
Costs also include fluctuation. The warm winter of 2024 improved the figures through weather and through emissions.[3] If the same policy rests on a single warm year, average cleanliness is not a property of the boilers. It is a property of February. If an app draws from a park, the cost is false calm in a canyon.
It is therefore useful to assess measures by the change of concentration and exposure in the place affected, not only by meeting of a limit at one station. For that the substance, the place, the time and the chosen reference value must all fit.
15. What to watch according to where you live
First it is necessary to determine the type of place and a suitable data source. The following table is not a ranking of cities; it shows when to compare an official station with a local signal in the same period and when their difference requires further measurement.
| Need | First figures | Decisive test | Unacceptable shortcut |
|---|---|---|---|
| Trend of the republic | AEI, CHMI yearbook | The same substance, the same station type, the same threshold | “It has fallen, therefore it is safe” |
| Street and school | Traffic station, passive NO2 | Distance from the roadway, height, peak hour | A park as a proxy for a canyon |
| A valley municipality | Rotating stations, sensors, fuel | Inversion, boiler type, wood moisture | Nationwide PM2.5 as a verdict on a basin |
| O/K/F-M agglomeration | BaP, industry, stoves | Separate the steelworks from the stove | One report on “Ostravsko” |
| Personal airing | Station + wind + time | Where the app takes the point from | An index without a station ID |
In Czech conditions it is necessary to verify the heating season separately. Summer ozone, winter combustion and the traffic peak have different mechanisms. A foreign ranking of cities will not show the fuel in a particular municipality, and sometimes the right conclusion is that the nearest station does not represent the given place.
Some cities need more layers. One for the trend, a second for arteries, a third for boilers. That is not a failure of standardisation. It is the same decision as using a different thermometer in a boiler room and a different one on the square. The condition is that the division is intelligible and that data are not translated unchecked from a park into a canyon.
16. A short test that says more than a national average
A first local check can be started even before the next yearbook. It does not determine definitive health risk; it verifies the data source, the station type and situations in which the national average may not represent the municipality.
Fourteen days from impression to map
- Days 1–2: Find the nearest CHMI station, its type, ID and distance.
- Days 3–4: Compare the annual average with the EU limit, the 2030 limit and WHO.
- Days 5–7: In the heating season track daily PM2.5; evaluate benzo[a]pyrene from available longer-term measurements and the yearbook, because an ordinary daily figure is usually not available.
- Days 8–10: Check fuel in the surroundings and the traffic artery; separate the boiler from the exhaust.
- Days 11–12: If you use a sensor, compare it with a reference station, not with feelings.
- Day 13: Stress test: inversion, calm, Friday afternoon, Sunday heating.
- Day 14: Write down the limits: what the number measures, what it does not, when to open it again.
Three tests of local exposure
The first is spatial: is the station background, traffic, or industrial, and how far does it lie from the place where you breathe? The second is a threshold: are you comparing 25, 10, or 5 µg/m3 for PM2.5? The third is about substance: does clean dust fail to address a problem that benzo[a]pyrene holds? A product that answers a minute earlier need not be better if, an hour later, nobody can find out which station it used.
Before you open a window according to an app
- Find the station ID, not only the colour.
- Separate the annual average from today’s hour.
- In a winter valley do not take an urban park as a proxy.
- By a school look for NO2 and traffic, not only PM.
- With boilers look for benzo[a]pyrene and fuel, not only “PM2.5 met”.
A comparison requires the same week, substance and reference value. A model map and a direct measurement are different products; their difference must be stated expressly. When testing the place itself it is on the contrary advisable to unify the source or method.
A local check should end with a rule of use: which station represents which place, what the average is for, what the municipality must measure in addition and when it will revise the result. Weather, fuel and traffic change, so the conclusion needs a date.
17. An average can conceal uneven exposure
The first generation of air reports sold desulphurisation. The next generation met PM limits. Today’s yearbooks sell something larger: the impression that the republic as a whole breathes the same thing. That is why the contest is not only for a lower microgram. It is a contest over which layer may speak for all the others.
The smoother the average that arises, the higher the price of overlooking can be. Basins fit poorly into the AEI. Canyons fit poorly into a background station. Boilers fit poorly into a headline about PM2.5. People cease to distinguish their own street from a map in which it has been smoothed away.
The average remains important: it documents a fall in the urban PM2.5 exposure indicator of 54.1 per cent between the baseline period 2009–2011 and 2023.[1] Local use must, however, add to it station type, fuel, traffic and a procedure for inversion situations.
The usefulness of a figure is determined neither by the lowest value nor the prettiest colour in an app. Resolution must match the question posed and its blind spots should be visible, named and taken into account in the decision.
The moment we read a yearbook, we choose a trend. The moment we open a window above boilers according to an index or send children to an arterial road, we also choose a new structure of responsibility. And then the question is no longer: “Is the average air in the republic clean?”
When reading an average we should therefore ask: Who remains outside its resolution, and by which legal or health reference are we assessing the result?
— Jiný Kontext